Mind Maps

Your constantly-updated definition of Mind Maps and collection of videos and articles.
Be a conversation starter: Share this page and inspire others!

493 Shares

What are Mind Maps?

Mind maps are visual diagrams that structure information around a central idea, with linked ideas branching out. Designers use them to organize thoughts, analyze information and develop creative solutions. Mind maps give a clear structure and hierarchy of thoughts and make complex concepts easier to understand. They include a central idea, topics and subtopics showing as nodes, and branches connecting these nodes.

A diagram showing mind map guidelines.

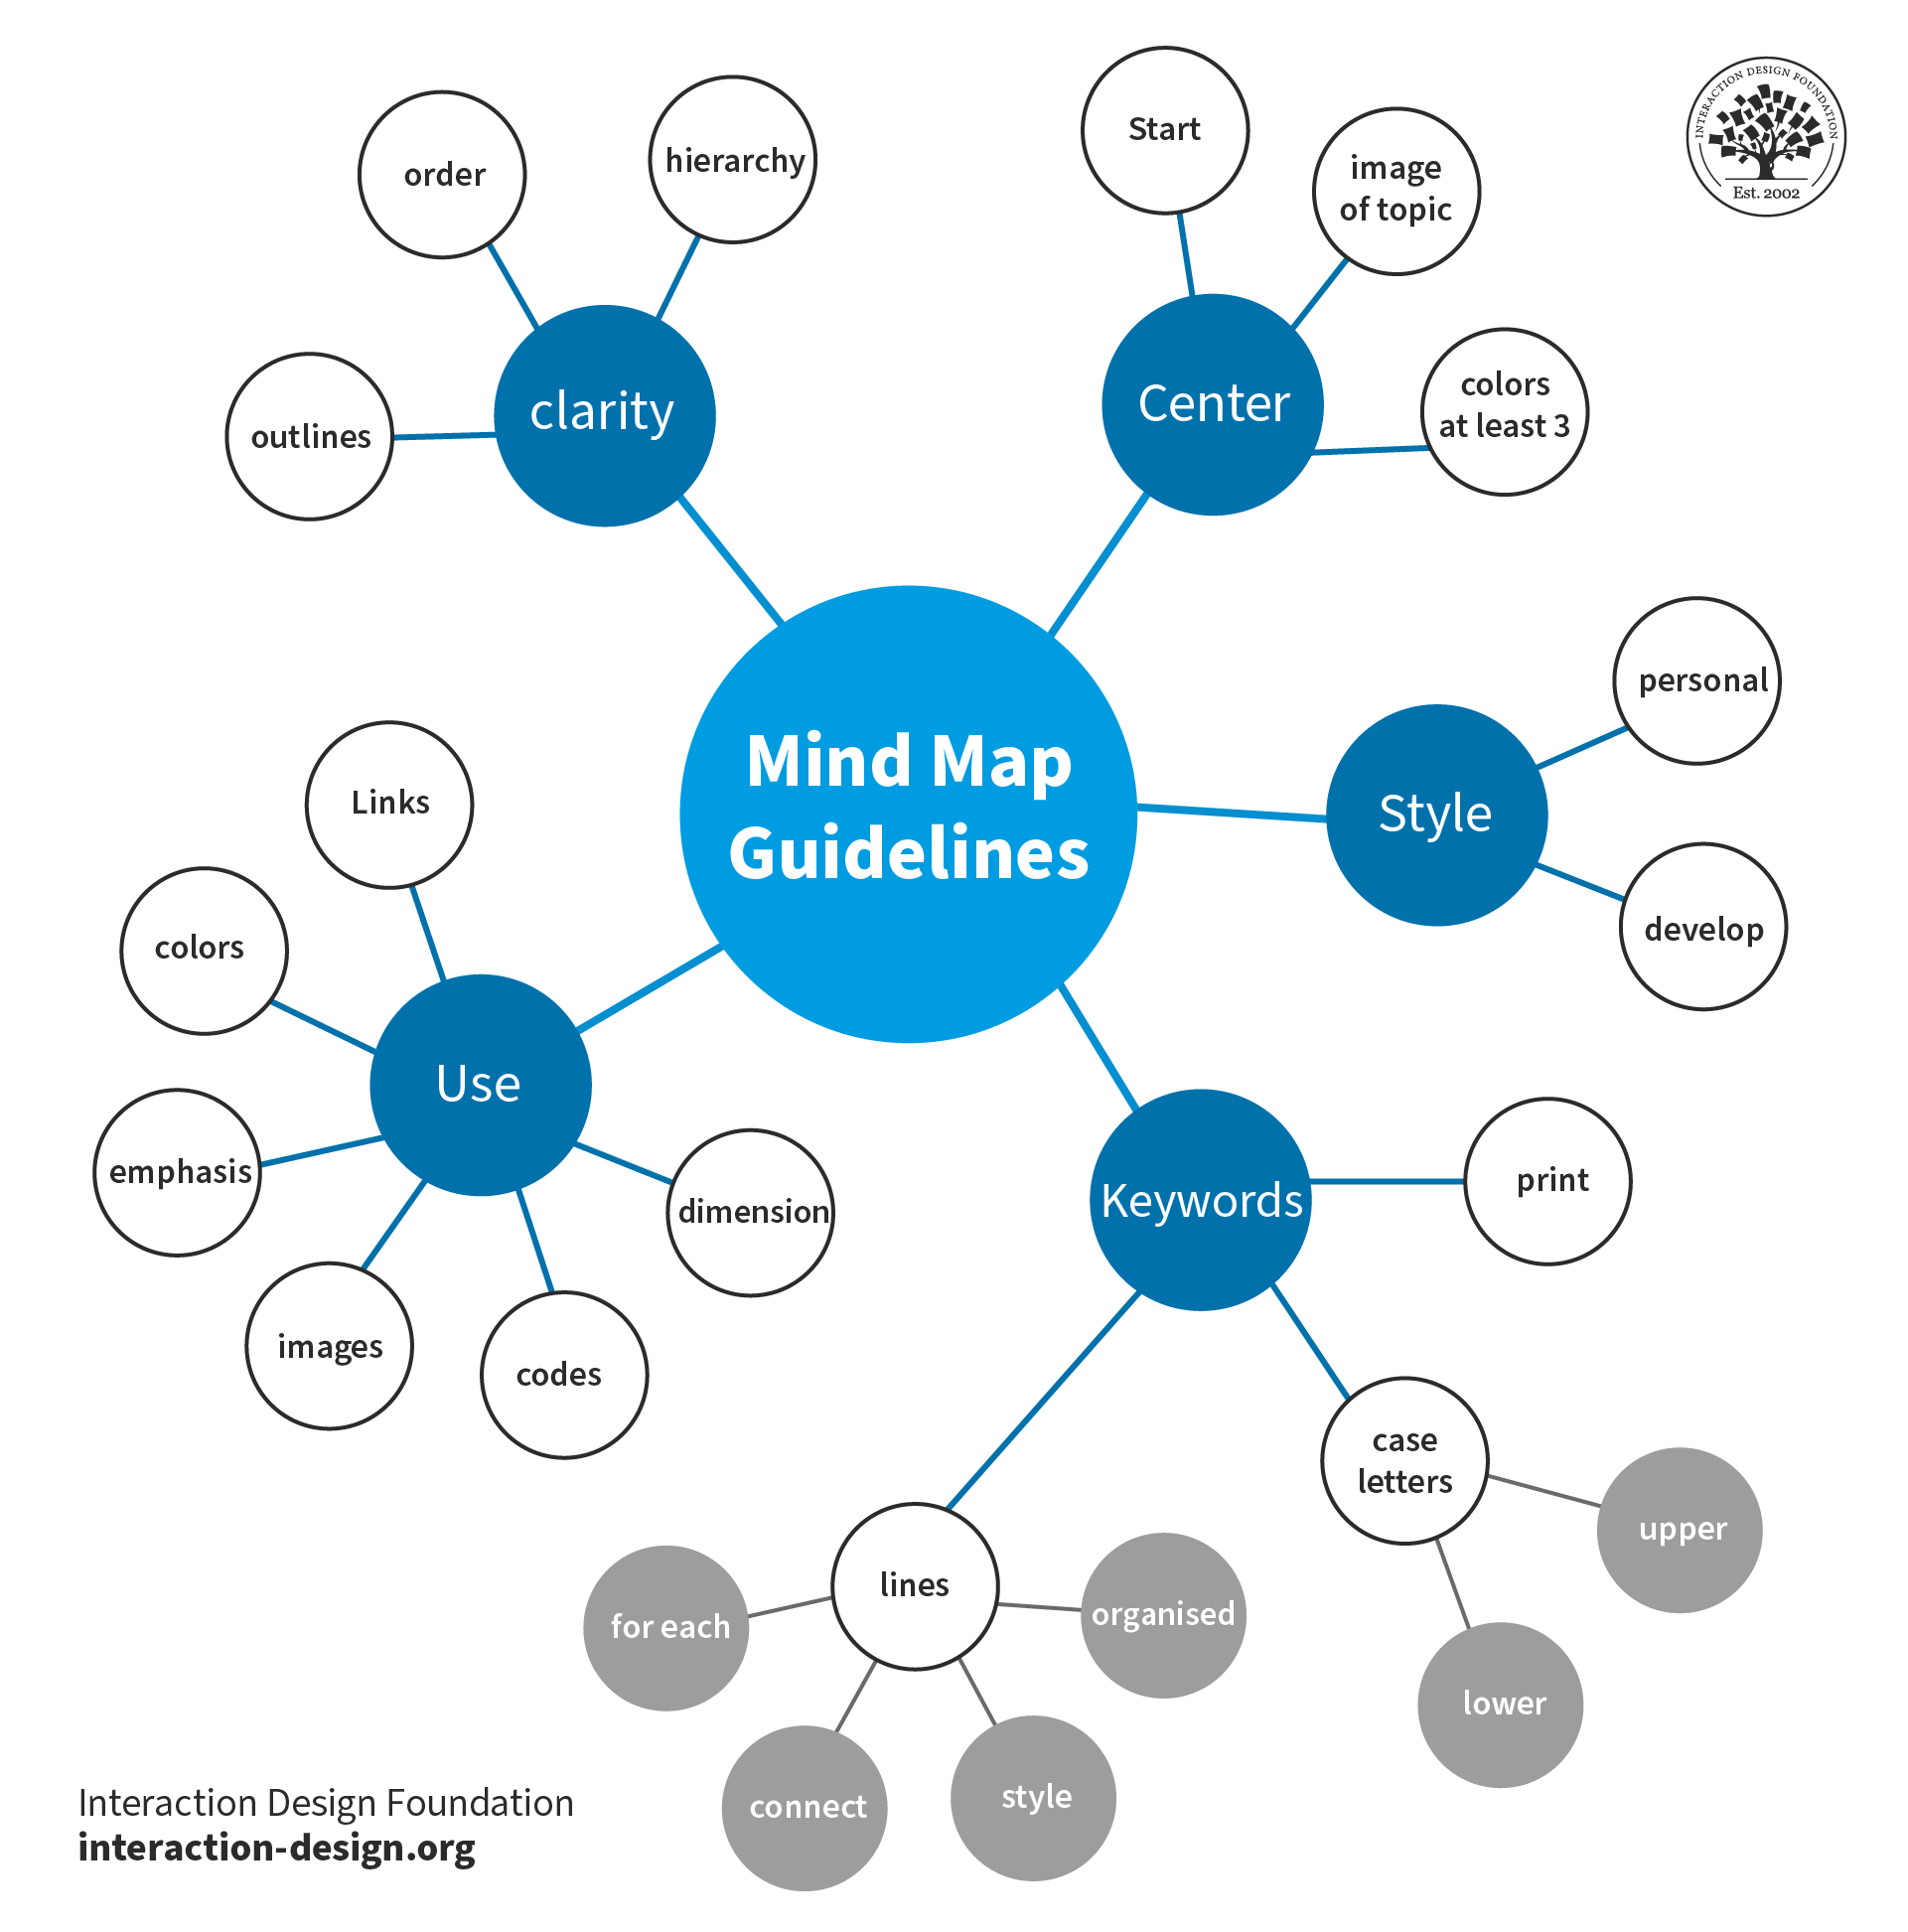
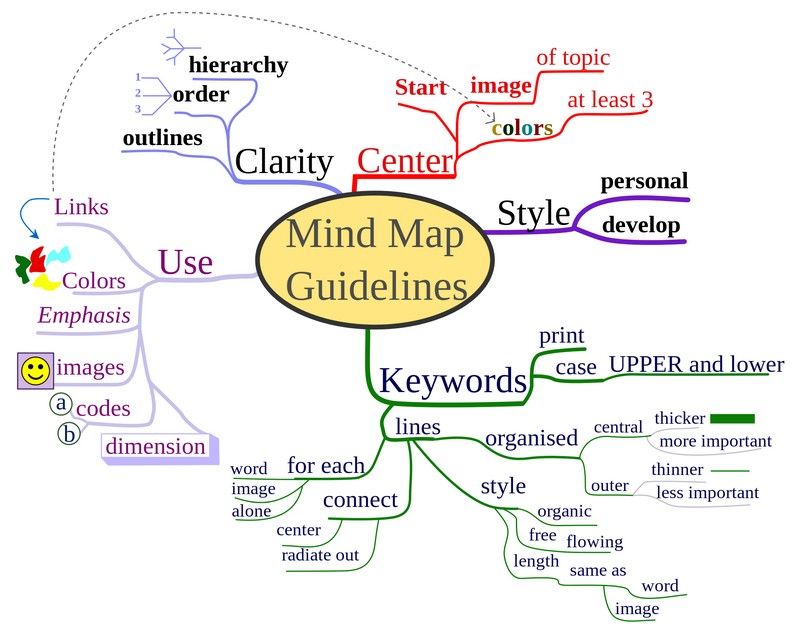
Mind maps are a helpful way to clearly flow out ideas and build on them.

© Nicoguaro. Copyright terms and licence: CC BY-SA 3.0

Why are Mind Maps Important in UX Design?

In user experience (UX) design, effective organization and a clear understanding of information are nothing short of vital for any digital product to succeed. Sure enough, designers and design teams depend on this clarity to help create user-friendly products and services. One powerful tool that designers can get working for them is a mind map. Psychology Author and Television Presenter Tony Buzan coined the term “mind mapping” in 1974 as a form of brainstorming. Mind maps—or spray diagrams or spider diagrams—give a visual representation of information. This makes it easier to navigate and comprehend complex concepts from a high level as well as in finer granularity.  

Mind maps play a crucial role in UX design, project planning and many other areas—such as working with market research. They help designers organize their thoughts, analyze information and develop creative solutions from a big-picture vantage point. Such maps can also incorporate color coding and icons to help with comprehension and navigation. Here are some key reasons why these maps are important:   

1. Enhanced Information Organization

Mind maps are tools that empower designers to visually structure information and organize it in a clear way. When designers set out their ideas and concepts in a hierarchical style, they can easily achieve several things: They can find relationships, prioritize information and create logical flows within their designs. This improves the overall organization—as well as the clarity of the UX design process.  

2. Improved Problem-Solving and Creativity

These maps stimulate creative thinking and problem-solving. That’s because they let designers get out and explore different possibilities and connections. When designers visually map out ideas, they can start building up new insights, identify patterns and uncover innovative solutions to the design challenges that are facing them. The visual nature of mind maps encourages out-of-the-box thinking—and it helps the design team generate creative ideas in their brainstorming sessions. 

Author and Human-Computer Interaction Expert, Professor Alan Dix explains thinking outside the box in this video: 

Transcript
 

3. Clear Communication and Collaboration

The maps serve as effective communication tools. They enable designers to present complex information in a simple and visually appealing format that’s easy to understand for other team members—some of whom may not be as much of visual designers. These maps make it easier for design team members to collaborate more effectively—along with stakeholders and clients—since they give a shared understanding of design concepts and project goals. Mind maps are deliverables that are really easy for design teams to share, review and modify—ideal for a design process that’s truly collaborative and iterative. 

4. Enhanced User Understanding

Mind maps help designers gain a deeper understanding of the users' needs, goals and preferences. As designers organize user research findings and insights this way, they can identify user patterns, customer touchpoints, pain points and motivations. This understanding informs the design process early on—and long before usability tests of the mobile apps that teams might design, for example. It enables designers to create user-centered experiences in digital products and services that meet their users' expectations and goals.  

5. Efficient Project Management

These maps can work as a powerful aid in project management since they give a visual overview of the design process. Designers can use mind maps to plan and track project milestones, allocate resources and set their priorities. The visual representation of tasks and timelines like this helps streamline the project management process. This streamlining goes a long way to making sure of an efficient workflow and the timely delivery of design projects.

An image of a mind map.

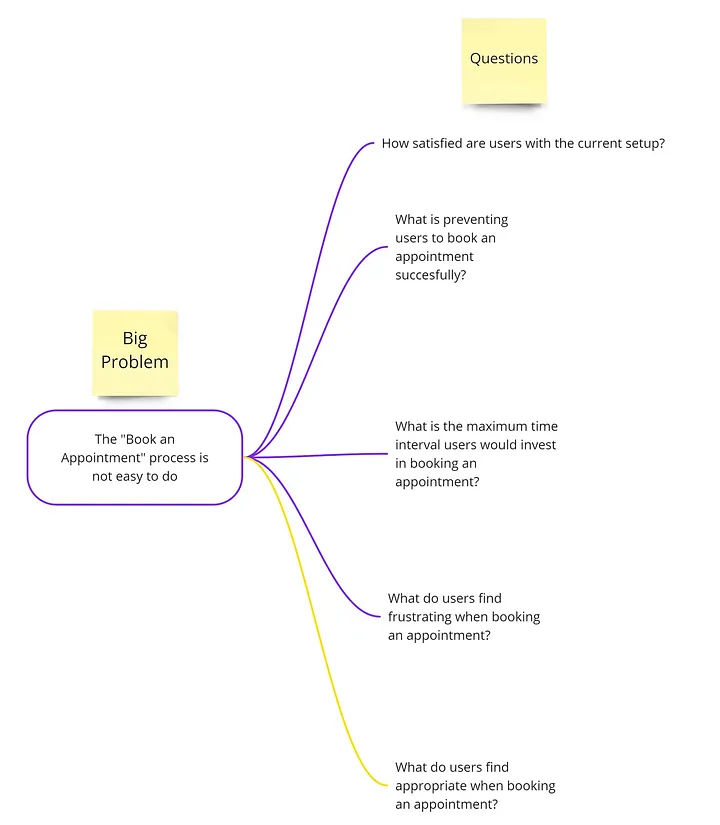
This mind map presents a big problem or main idea for a design team to address with questions.

© Magda Mihalache, Fair Use

How to Create Mind Maps

Designers can employ mind maps at various stages of the design process to organize information, generate ideas and structure designs. Designers can follow this step-by-step process where they:  

1.  Define the central idea or main topic of the mind map. This should be a concise and clear statement that encapsulates the purpose or objective of the design project. 

2. Identify key themes and subtopics related to the central idea. These can be broad categories or specific areas of focus within the design project.  

3.  Create nodes for each key theme or subtopic. These nodes will serve as the main branches that stem out from the central idea.  

4.  Add branches that connect each node to the central idea. These branches represent the relationships between the main topic and the subtopics.  

5.  Expand subtopics to make them more detailed. For each subtopic, designers further expand the map when they put in additional nodes and branches. These represent more specific ideas, concepts or features related to each subtopic.  

6.  Use color coding and icons to improve how visually clear the mind map is. Designers assign different colors to different themes or subtopics, and they use icons to represent specific ideas or concepts.  

7.  Review and refine the mind map to make sure that it accurately represents the information and relationships the designers want to show. They should refine the structure, wording and visual elements—as needed—to improve clarity and readability.  

An illustration of a mind map.

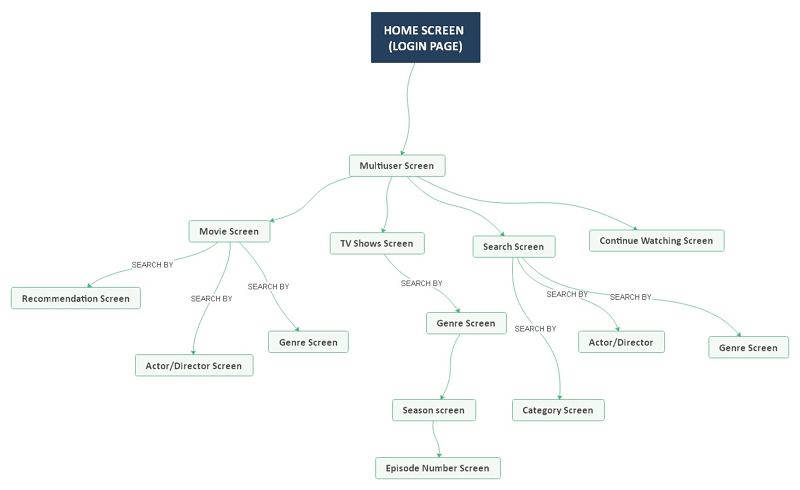
This mind map represents the workings of Netflix’s UI, as well as the flow involved when a user logs onto the app or website.

© EdrawMind, Fair Use

Tips to Make Effective Mind Maps

Designers can follow some best practices for mind mapping techniques, such as these: 

1. Keep It Simple

Use concise and clear wording for nodes and branches. Avoid lengthy descriptions or complex language that may keep users from understanding properly.   

2. Use Visual Elements

Incorporate icons, symbols and images to boost the visual appeal of and how well people will understand the map. Visual elements can help carry information more effectively and engage viewers that much better.   

3. Prioritize Information

Arrange nodes and branches in a logical and hierarchical order. Be sure to put the most important information in a position that’s prominent. Information that’s set out like this makes sure that the most crucial concepts and ideas are easy for team members and stakeholders to access and understand.   

4. Foster Creativity

The map is there to develop; so, it’s vital to allow for flexibility and creativity in it. Encourage the exploration of different ideas and connections—even if they seem unconventional at first. These maps are a tool to help generate innovative solutions and think outside the box.   

5. Iterate and Refine

Mind maps aren’t static. The idea is that they evolve and adapt as the design process moves forward. Designers should continue to review, refine and update mind maps whenever new insights and ideas come to the surface.   

What are Helpful Tools for Mind Mapping?

Here—and in no particular order—are some of the best programs that UX designers commonly use:  

1.  MindMeister: a popular online mind mapping tool that offers a user-friendly interface and collaborative features. It allows for easy creation, editing and sharing of mind maps—making it suitable for team collaboration.  

Image of a mind map using MindMeister.

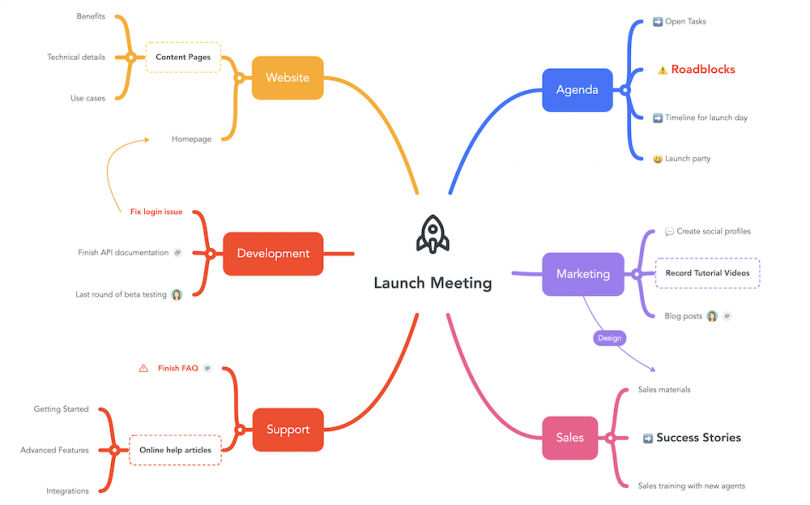
A MindMeister mind map diagrams a launch meeting.

© MindMeister, Fair Use

2. XMind: a versatile mind mapping software that offers a range of features. These include various templates, advanced brainstorming tools, as well as seamless integration with other productivity tools.  

An image of a mind map using Xmind.

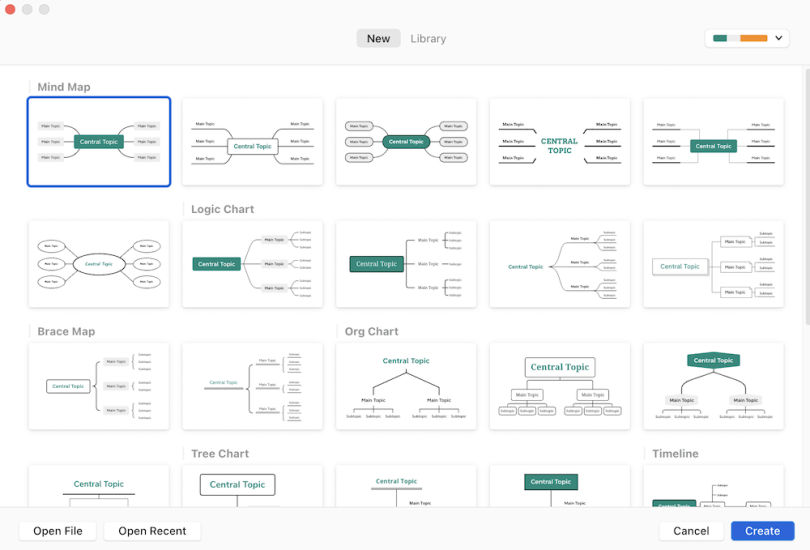
XMind supports diagram formats in addition to mind maps, such as logic charts, brace maps, org charts and tree charts.

© Built In, Fair Use

3. EdrawMind: a full-featured cross-platform tool for mind mapping, brainstorming, outlining and presentation

An image of a mind map using EdrawMind.

This EdrawMind map displays branches.

© EdrawMind, Fair Use

4. Coggle: a web-based mind mapping tool that provides a simple and intuitive interface. It offers real-time collaboration, customizable themes and the ability to add images and links to mind maps.  

An image of a mind map using Coggle.

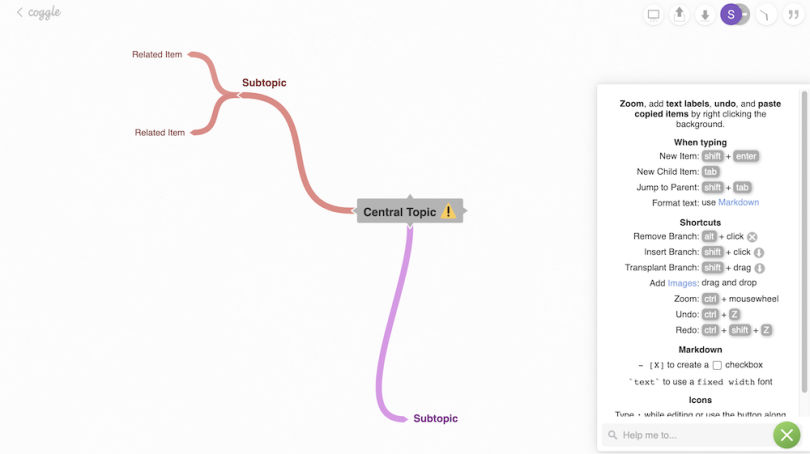
A work-in-progress Coggle mind map; the quick-keys guide is open (right-hand side).

© Built In, Fair Use

5. Miro: a digital collaboration platform that offers a wide range of tools, including mind mapping. It provides a collaborative workspace where teams can create, edit and share mind maps in real-time.  

An image of a mind map using Miro.

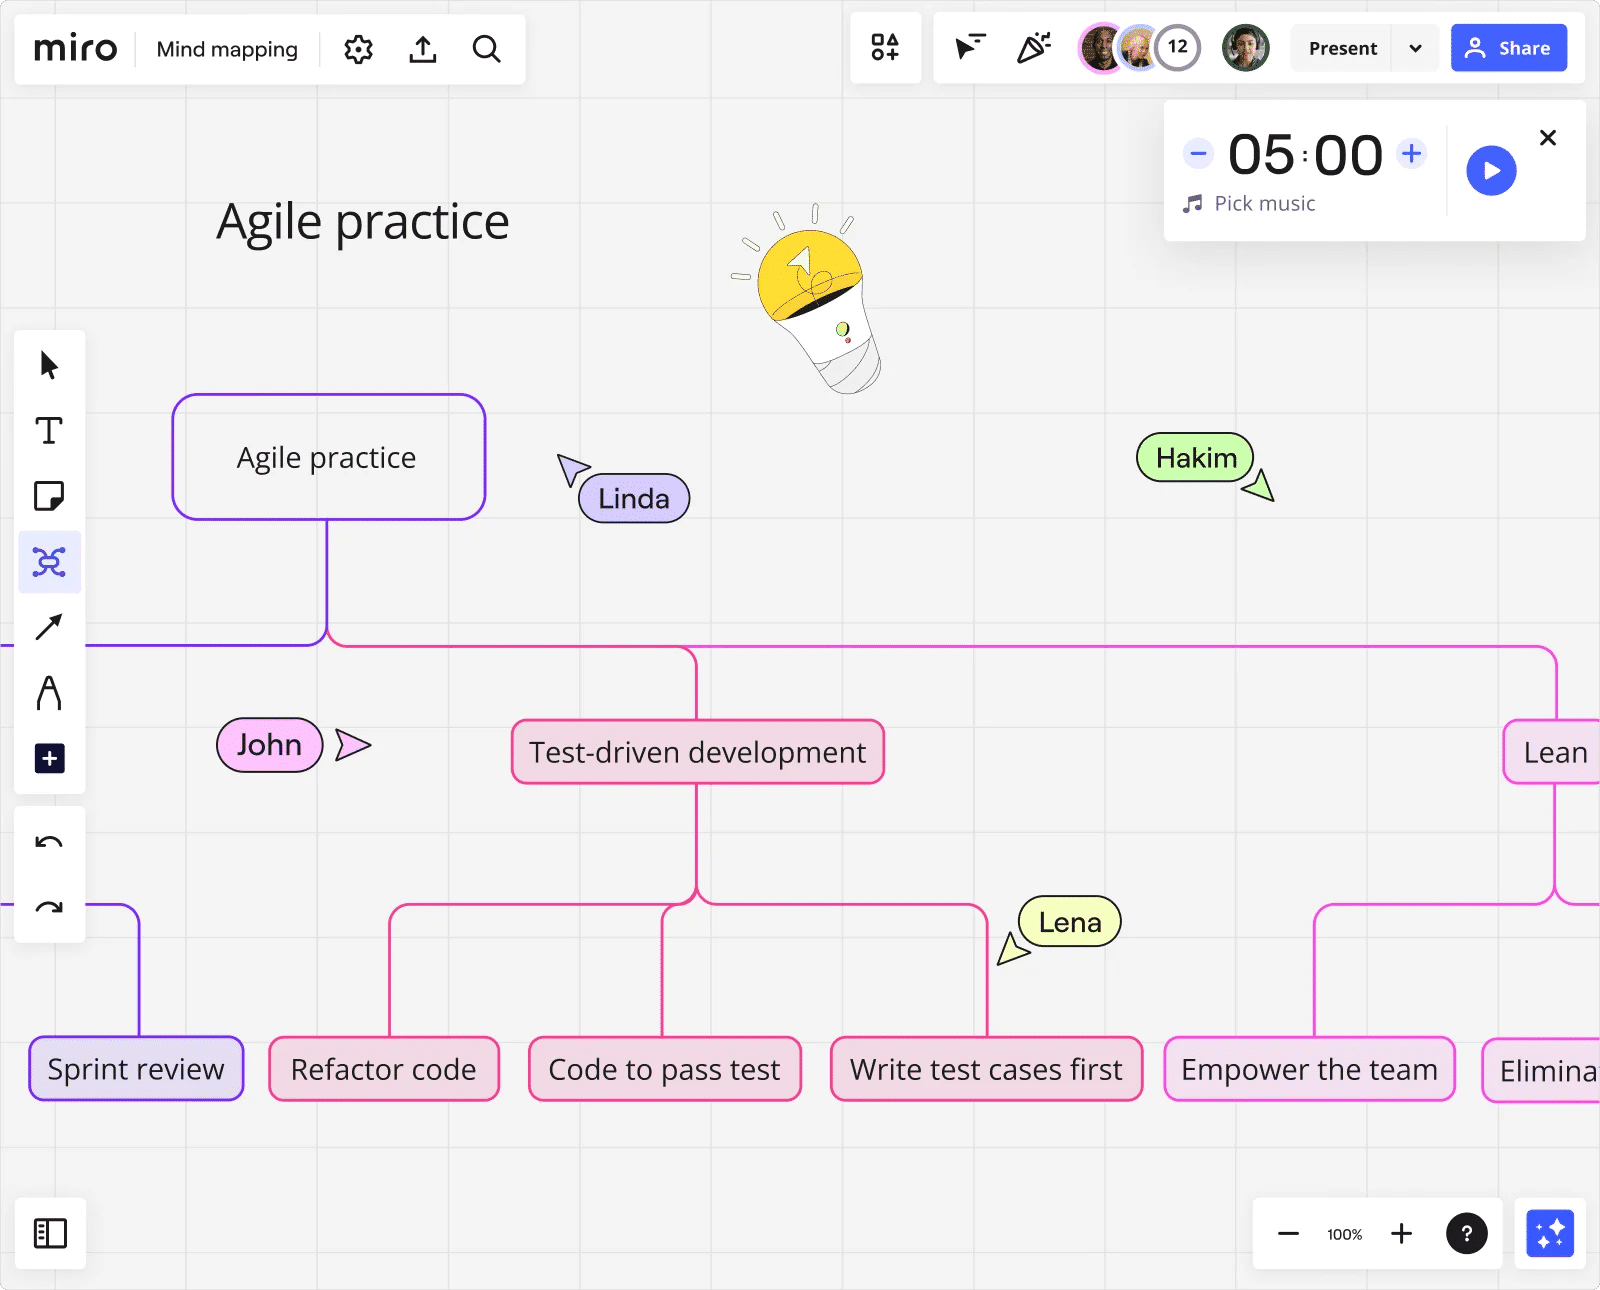
This Miro mind map charts processes and sub-processes in Agile software development.

© Miro, Fair Use

6. Lucidchart: a cloud-based diagramming tool that includes mind mapping functionality. It offers a drag-and-drop interface, collaboration features and integrations with other popular tools.  

A template of a mind map using Lucidchart.

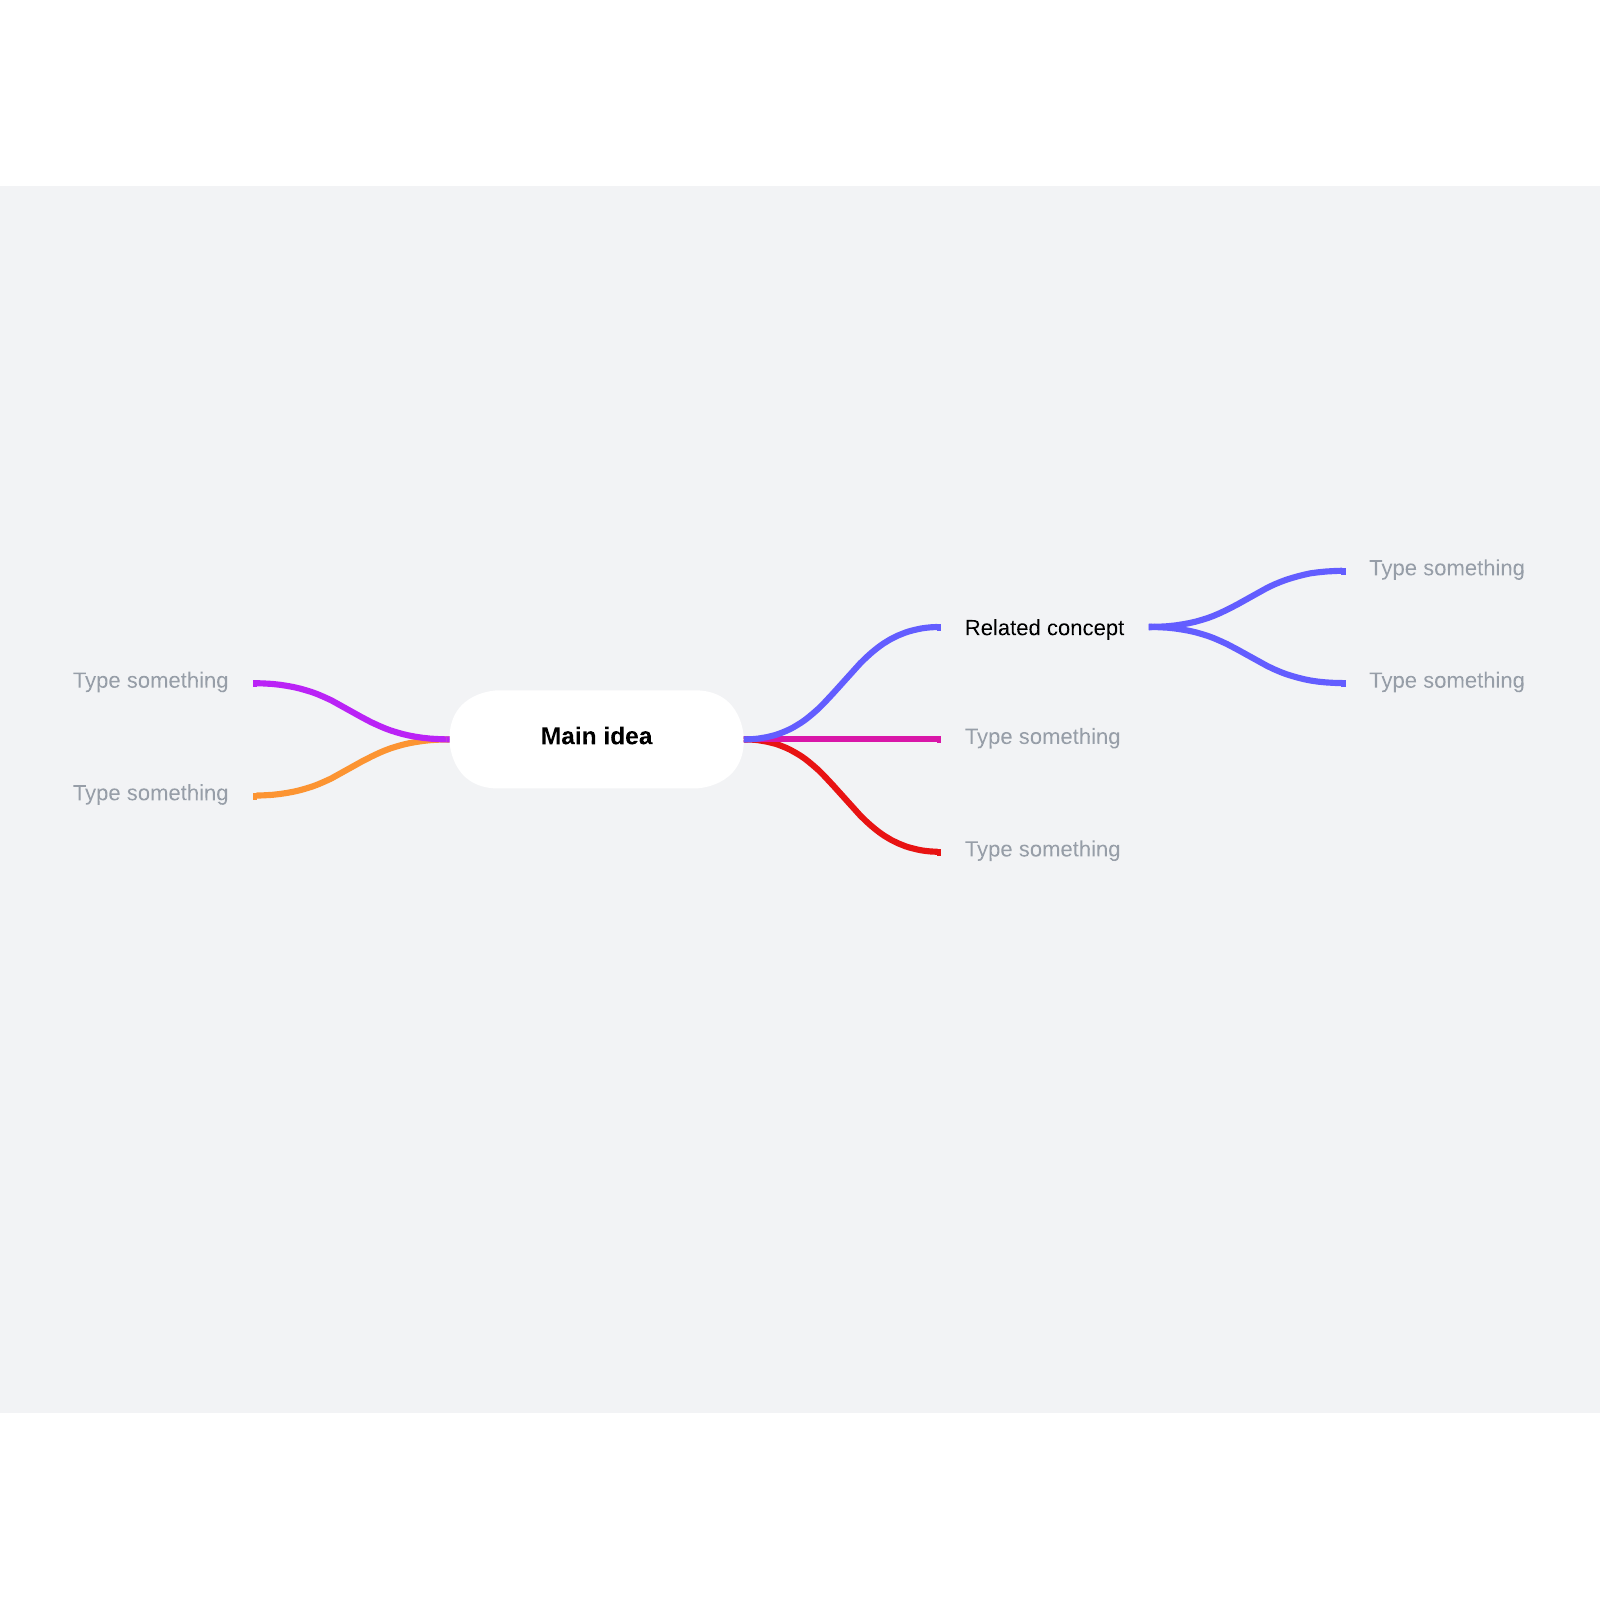
This template from Lucidchart can help designers and teams grow and flow ideas.

© Lucidchart, Fair Use

It’s important for designers to consider several factors when they select a mind mapping software program. These include ease of use, collaboration features, customization options and integration capabilities with other tools that they use in their design process.  

Examples of Mind Maps

Such maps can take various forms and have uses in a multitude of contexts. Here are some examples used in UX design:   

1. User Journey Map

A mind map can visually represent the user's journey through a product or service. It can highlight key touchpoints, pain points and opportunities for improvement. User journey maps and customer journey maps are important UX deliverables in any case—so, it’s valuable to have this visualization in place early on. 

CEO of Experience Dynamics, Frank Spillers explains how to map a user journey for a service in this video: 

Transcript
 

2. Information Architecture Map

A mind map can help organize information and define the structure of a website or application. It can show the hierarchy of pages and their relationships. As such, it can serve as a kind of foundation or wireframe for what the design team have got in mind.   

3. Concept Ideation Map

A mind map is an excellent tool to brainstorm with and explore different design concepts. As it facilitates such levels of creativity, it frees a design team to generate and organize ideas for a new product or feature. 

Watch our video on brainstorming for insights into this powerful group activity: 

Transcript
   

4. Content Strategy Map

A mind map can help a design team plan and organize content for a website or application. It maps out the various sections, pages and content types—such as the best material for a landing page.   

The versatility of mind maps lets designers adapt them to their specific design needs and objectives. In a similar way to how user personas help bring qualities and needs of a target audience to the surface for the design team to work with, mind maps help bring ideas to life for designers and developers and others associated with a project. 

Remember the power of UX design mind maps as tools to foster collaboration regarding how to understand potential customers, feel out content ideas for ideal customers and users, identify types of content that best suit business goals—and much more. Mind mapping for design thinking is particularly effective, and it’s important to leverage mind map templates. With the right map, a team can drive innovation and help create user-centered design experiences and product designs that truly resonate with their target audience.  

Questions About Mind Maps?
We've Got Answers!

What challenges do UX designers face when they create mind maps and how do they address them?

When designers create mind maps, they often run into several challenges. These tend to include information overload, organizing complex data and making sure that productive collaboration happens. So as to address information overload, designers prioritize data by focusing on the most critical user needs and design objectives. This approach helps in filtering out less relevant information and maintaining clarity within the mind map. To organize complex data effectively, designers use colors, symbols and branches so they can categorize and link related ideas. This visual differentiation helps to navigate the mind map—and highlights relationships between different concepts. For instance, to use distinct colors for different user groups or design elements can make the map easier to understand at a glance.  

To make sure that fruitful collaboration among team members occurs can also pose a challenge, and that’s especially so in remote settings. Designers tackle this by using digital mind mapping tools that allow for real-time collaboration. These tools empower team members to contribute simultaneously, share insights and provide feedback—which ensures that the mind map does indeed reflect a collective understanding of the project.  

See more about brainstorming in our video: 

Transcript
 

How do you start a mind map for a UX project?

To start a mind map for a UX project, first, choose a central idea or concept related to the project. Write this idea at the center of a blank page or digital canvas. From there, draw branches that represent main categories or themes related to your central idea. These could be user needs, design elements or functionalities. For each main category, extend further branches to break down the categories into more specific aspects or tasks. Remember to keep your mind map clear and organized—use colors, icons or symbols to categorize or prioritize information. This visual organization helps you and others spot relationships between different elements of the project and nurtures creative solutions. Finally, make sure you review your mind map and update it as your project keeps evolving. This dynamic tool adapts to the changing needs and insights of your UX project. That makes it an invaluable resource for brainstorming, planning and communication among team members. 

Take our Master Class Harness Your Creativity To Design Better Products with Author and Human-Computer Interactivity Expert, Professor Alan Dix. 

How do mind maps help in understanding user needs?

Mind maps serve as powerful tools for understanding user needs in UX design. As mind maps visually organize thoughts and ideas, they let designers see connections and patterns that mightn’t be obvious at first glance. When you create a mind map, you start with the user at the center—and from there, branch out to different aspects of their experience, such as challenges, motivations and goals. This method highlights the hierarchy and relationship between different user needs—and so makes it easier to prioritize them in the design process.  

What’s more, mind maps make collaboration easier among team members. They provide a clear and accessible overview of user needs. Plus, they make sure everyone understands the user perspective. This shared understanding helps with generating more targeted and creative solutions. Another point is that mind maps are adaptable. As new insights emerge from user research, you can easily update them, and so make sure the design process remains user-centered. Overall, mind maps are invaluable for distilling complex user data into a cohesive understanding—which guides the design process towards more intuitive and user-friendly solutions. So, they can serve as valuable deliverables within case studies where teams have worked their way towards winning design solutions. 

Take our Master Class A Guide To Hassle-Free Designer-Developer Collaboration with Szymon Adamiak, Co-Founder, Hype4 Mobile. 

What role do colors and images play in UX design mind maps?

In UX design, colors and images play crucial roles in enhancing mind maps. That makes them not just more visually appealing but more effective as tools for communication and idea organization, too. Colors help to categorize and prioritize information—letting designers quickly differentiate between various themes or concepts at a glance. For instance, if designers use a distinct color for each user need or design challenge, it makes it easier to identify and focus on specific areas of interest. 

Images, on the other hand, serve as visual shorthand. They enable designers to represent ideas quickly and intuitively. They can symbolize complex concepts or emotions that might take longer to describe with words. So, they speed up the understanding and brainstorming process. What’s more, the use of images makes mind maps more memorable and engaging. That can be particularly useful in collaborative settings, and make sure that key insights stand out and that team members or stakeholders won’t overlook them. 

Together, colors and images transform mind maps from simple outlines into dynamic, informative and inspiring visual tools. They make for deeper understanding and creativity; plus, they help UX designers to effectively explore and address user needs, while also nurturing a more collaborative and inclusive design process. 

Arielle Eckstut, Author and Co-Founder of The Book Doctors and LittleMissMatched, and Joann Eckstut, Color Consultant and Founder - The Roomworks, explain color and its importance in this video: 

Transcript


Take our Master Class How To Use Color Theory To Enhance Your Design with Arielle Eckstut and Joann Eckstut. 

How do you convert a mind map into a UX design prototype?

To convert a mind map into a UX design prototype is something that takes a few structured steps. First, review your mind map to identify the main user needs and design concepts. These elements form the backbone of your prototype, and guide the layout and functionality. 

Next, prioritize the features or ideas in your mind map based on user needs and project goals. This step helps you decide what to include in the initial prototype. Begin sketching wireframes or using digital tools to create basic layouts that represent your prioritized ideas. These wireframes serve as the visual blueprint for your prototype—and they show how users are going to interact with the design. 

After you sketch, select a prototyping tool that suits your project needs. Transfer your wireframe sketches into the tool, refining them into interactive prototypes. At this stage, focus on usability and user flow rather than detailed aesthetics. 

Finally, test your prototype with users so you can get and gather feedback. Use insights from this testing to refine your design—and iterate until it meets user needs effectively. This process turns the abstract ideas in your mind map into a tangible and user-centered design prototype, ready for further development. 

Professor Alan Dix explains the importance of and need for prototyping in this video: 

Transcript
 

How do mind maps support the creation of user personas?

Mind maps greatly support the making of these since they give a visual framework to organize and analyze research data about potential users. When you start with a central concept—like a specific user group or project goal—you can branch out to include various characteristics of your target users. These branches can represent demographics, behaviors, needs, goals, frustrations and preferences. 

As you add layers to the mind map, you categorize and connect different pieces of information. That helps you identify patterns and insights. This process makes it easier to see the common traits among potential users, and it guides you as you create detailed and accurate user personas. These personas then act as reference points for design decisions, and ensure that the product meets the real needs of its users. 

Watch this video as UX Strategist and Consultant, William Hudson explains the significance of user personas in design: 

Copyright
Transcript
 

Take our Master Class How To Create Actionable Personas with Daniel Rosenberg, UX Professor, Designer, Executive and Early Innovator in HCI. 

How do you keep a UX design mind map focused and organized?

To do this, start by defining a clear central theme or question. This theme acts as the anchor for all subsequent ideas, and it makes sure the mind map remains relevant to your project goals. Next, use branches to categorize information logically, and group related ideas together. This structure helps to maintain clarity and prevents the map from becoming cluttered. 

To use colors and symbols is another highly effective strategy. Assign different colors to various categories or priorities—and so make the map visually organized and easier to navigate. Symbols can represent specific types of information or actions, a factor that adds another layer of organization. 

To limit the amount of text on each branch is good as it encourages simplicity and focus. Instead of long descriptions, use keywords or short phrases that capture the essence of an idea. This approach keeps the mind map clean and accessible. 

It’s crucial to regularly review and refine the mind map. As the project evolves, some ideas may become less relevant, while new insights come up. Update the mind map to reflect these changes, and also remove outdated information and add new findings. This practice ensures that the mind map remains a useful, focused tool throughout the design process. 

Consult our piece The Principles of Information Visualization for Basic Network Data

How do you present a mind map to stakeholders in a UX project?

To present a mind map to stakeholders in a UX project is a task that takes a clear and structured approach. First, make sure that the mind map is visually appealing and easy to understand. Use colors, symbols and clear labels to organize information logically. This visual clarity helps stakeholders quickly grasp the main ideas and their connections. Start the presentation by explaining the central concept or goal of the mind map. Then, guide stakeholders through the main branches; highlight key insights, user needs and design considerations. Focus on how these elements relate to the project objectives and the decisions they inform. Be prepared to zoom in on specific details or branches as questions arise. 

Stakeholders might be interested in particular aspects of the project—like user pain points or design solutions. When you’ve got a flexible presentation style it lets you address these interests directly. What’s more, emphasize how the mind map has made the design process easier. Share examples of how insights from the mind map have influenced design choices or strategies. This demonstrates the value of the mind mapping approach in driving user-centered design decisions. Finally, invite feedback and suggestions. To engage stakeholders in a dialogue about the mind map can provide valuable perspectives and foster collaboration. It’s an opportunity to refine your understanding of user needs and project goals based on stakeholder input. 

Take our Master Class Win Clients, Pitches & Approval: Present Your Designs Effectively with Todd Zaki Warfel, Author, Speaker and Leadership Coach. 

How do mind maps help to document and organize UX research findings?

Mind maps help do this by providing a visual and intuitive way to capture complex information. When you use a mind map, you start with a central theme related to your research—such as a specific user behavior or project goal. From this central point, you branch out to include different categories of findings, like user needs, pain points and preferences. This branching structure helps you logically organize data. That makes it easier to see connections between different observations. For example, you can link user needs directly to design recommendations, and create a clear pathway from research insights to actionable solutions. Also, mind maps enable you to prioritize information.  

When you use different colors or symbols, you can highlight key findings or urgent issues, and make sure that they stand out and receive appropriate attention during the design process. Mind maps are also great ways to make collaboration easier and more effective. By presenting research findings in a visual format, you make it accessible to team members who mightn’t be familiar with the details of the research. This shared understanding helps align the team’s efforts and supports a user-centered approach to design. Overall, mind maps transform the complexity of UX research findings into a structured, understandable and actionable format. This makes them an invaluable tool in the UX design process. 

Watch as William Hudson explains user research and why it is so important in this video: 

Transcript
 

How do you incorporate user feedback into a UX design mind map?

To incorporate user feedback into a UX design mind map is something that takes a few key steps to make sure that the design process remains user-centered. First, gather feedback from users through methods such as interviews, surveys or usability testing. This feedback should cover various aspects of the user experience, including usability, satisfaction and any difficulties users encountered. 

Next, review the feedback to identify common themes, problems and suggestions. This analysis helps in understanding the user's perspective and the areas that require improvement or reevaluation. 

Once you’ve identified these key insights, update your mind map to reflect this new information. You can add branches to represent user feedback—categorizing it by themes such as usability issues, feature requests or user satisfaction. Use colors or symbols to highlight feedback that needs immediate attention or has a deep impact on the user experience. 

To work user feedback into the mind map doesn’t just help in visualizing the changes needed; it also makes sure that the design process adapts to meet user needs. To regularly update the mind map with new feedback is something that keeps the design team aligned with user expectations; plus, it improves the overall design outcome. 

UX Strategist and Consultant, William Hudson explains about usability testing in this video: 

Transcript
 

Take our Master Class How to Get Started with Usability Testing Webinar with Cory Lebson, Principal and Owner of Lebsontech LLC. 

What are highly cited scientific articles on the subject of mind maps?

1. Farrand, P., Hussain, F., & Hennessy, E. (2002). The efficacy of the 'mind map' study technique. Medical education, 36(5), 426-431.  

This study was one of the first to empirically investigate the effectiveness of mind mapping as a study technique among medical students. The researchers found that mind mapping led to improved long-term factual recall compared to traditional note-taking methods. This study has been highly cited and has contributed to the growing body of evidence supporting the use of mind mapping in educational and professional settings.  

2. Eppler, M. J. (2006). A comparison between concept maps, mind maps, conceptual diagrams, and visual metaphors as complementary tools for knowledge construction and sharing. Information visualization, 5(3), 202-210.  

This paper provides a comprehensive analysis and comparison of various visual mapping techniques, including mind maps, concept maps and conceptual diagrams. It explores the unique characteristics, strengths and applications of each technique, highlighting their complementary nature in knowledge construction and sharing. This work has been influential in clarifying the distinctions and relationships between these visual tools, guiding researchers and practitioners in selecting the most appropriate technique for their needs. 

What are highly regarded books on mind maps?

Buzan, T., & Buzan, B. (1996). The Mind Map Book: How to use radiant thinking to maximize your brain's untapped potential. Plume.  

This seminal work by Tony Buzan and Barry Buzan is considered the foundational text on mind mapping. It introduced the concept of radiant thinking and provided a comprehensive guide on how to create and use mind maps to enhance learning, creativity and problem-solving. The book has been highly influential in popularizing mind mapping as a powerful cognitive tool and has inspired numerous subsequent studies and applications in various fields. 

Earn a Gift Earn a Gift, Answer a Short Quiz!

1
2
3
4
1
2
3
4
Question 1
Question 2
Question 3
Get Your Gift
Interaction Design Foundation logo

Question 1

What is at the center of a mind map?

1 point towards your gift

  • The main design problem.
  • User preferences and needs.
  • The central idea or main topic.
Interaction Design Foundation logo

Question 2

Why do UX designers use mind maps?

1 point towards your gift

  • To avoid researching user needs.
  • To visually organize information and improve creativity.
  • To create detailed product prototypes.
Interaction Design Foundation logo

Question 3

How do mind maps improve collaboration in UX design?

1 point towards your gift

  • By replacing wireframes in the design process.
  • By simplifying complex ideas and enabling shared understanding.
  • By allowing teams to avoid brainstorming sessions.

Learn More About Mind Maps

Make learning as easy as watching Netflix: Learn more about Mind Maps by taking the online IxDF Course Design Thinking: The Ultimate Guide.

Why? Because design skills make you valuable. In any job. Any industry.

In This Course, You'll

  • Get excited when you discover that you don't need to start from scratch to use the secret recipes that empower companies like Apple and Google to shape the future. You just need a structure and proven methods to optimize what you already do. As AI becomes part of your day-to-day workflows, your ability to guide it with timeless human-centered skills such as strategic thinking, creativity, and empathy for real users is what turns AI into your superpower and delivers meaningful results.

  • Build on your existing creativity, problem-solving, and people skills to learn the powerful 5-stage method called Design Thinking. It's one of the key drivers behind Apple and Google's continuous innovation and provides a clear, structured way to solve real-world problems. You've already got the instincts, so it's easy to learn the method. 

  • Make yourself invaluable with hands-on skills in Design Thinking. Design Thinking can help you break into User Experience Design, product design, and tech. It's widely applicable, impactful, and fun! Use your skills to improve customer support processes, create new products, and even tackle big challenges like climate change. This human-centered approach is a key driver of business success because it guides you to systematically understand and address what your users really need and want. That's why Design Thinking skills can help you increase sales, keep customers loyal, and turn them into powerful advocates for your company.

  • Gain confidence and credibility as you effortlessly apply methods from all five stages of the Design Thinking process. You'll be guided to build empathy and gather insights into people's habits through user interviews. 

  • Use our downloadable templates to create affinity diagrams, empathy maps, and actionable "How Might We" questions. Develop solutions as you apply ideation and innovation methods. Create a paper prototype early and fast, then test and optimize your prototype to ensure that your users love it. More love, more impact, greater salary potential. 

  • Apply your new skills in an optional project where you'll design and test a user-centered experience that's perfect for your portfolio and career growth. Master Design Thinking to amplify your uniquely human strengths like empathy, intuition, and creativity, and confidently stay in demand as AI reshapes how teams work.

It's Easy to Fast-Track Your Career with the World's Best Experts

Master complex skills effortlessly with proven best practices and toolkits directly from the world's top design experts. Meet your experts for this course:

  • Don Norman: Father of User Experience (UX) Design, author of the legendary book “The Design of Everyday Things,” and co-founder of the Nielsen Norman Group.

  • Alan Dix: Author of the bestselling book “Human-Computer Interaction” and Director of the Computational Foundry at Swansea University.

  • Mike Rohde: Experience and Interface Designer, author of the bestselling “The Sketchnote Handbook.”

Get an Industry-Recognized IxDF Course Certificate

Increase your credibility, salary potential and job opportunities by showing credible evidence of your skills.

IxDF Course Certificates set the industry gold standard. Add them to your LinkedIn profile, resumé, and job applications.

Course Certificate Example

Be in distinguished company, alongside industry leaders who train their teams with the IxDF and trust IxDF Course Certificates.

Our clients: IBM, HP, Adobe, GE, Accenture, Allianz, Phillips, Deezer, Capgemin, Mcafee, SAP, Telenor, Cigna, British Parliament, State of New York

All Free IxDF Articles on Mind Maps

Read full article
Ideation for Design  - Preparing for the Design Race - Article hero image
Interaction Design Foundation logo

Ideation for Design - Preparing for the Design Race

Ideation is easy to define. It’s the process by which you generate, develop and then communicate new ideas. Ideas can take many forms such as verbal, visual, concrete or abstract. The principle is simple to create a process by which you can innovate, develop and actualize new products. Ideation is c

Social shares
870
Published
Read Article
Read full article
The Principles of Information Visualization for Basic Network Data - Article hero image
Interaction Design Foundation logo

The Principles of Information Visualization for Basic Network Data

Not all data has dependencies or a linear structure. In fact some data is related by either or a combination of two properties: connection and containment. These data sets are considered to be networks.An easy example of a network is the London Underground Tube Network. Here the stations are either

Social shares
688
Published
Read Article
Read full article
Introduction to the Essential Ideation Techniques which are the Heart of Design Thinking - Article hero image
Interaction Design Foundation logo

Introduction to the Essential Ideation Techniques which are the Heart of Design Thinking

Ideation is at the heart of the Design Thinking process. There are literally hundreds of ideation techniques, for example brainstorming, sketching, SCAMPER, and prototyping. Some techniques are merely renamed or slightly adapted versions of more foundational techniques. Here you’ll get an overview o

Social shares
1.2k
Published
Read Article
Read full article
Revolutionize UX Design with VR Experiences - Article hero image
Interaction Design Foundation logo

Revolutionize UX Design with VR Experiences

Is the future of user experience design (UX design) going to exist on screens or will it find immersive, three-dimensional spaces as its main home? You can design for both views—and interactions—within a digital environment that’s boundless in virtual reality (VR), so read on to find five fundamenta

Social shares
620
Published
Read Article
Read full article
Cognitive Maps in UX | IxDF - Article hero image
Interaction Design Foundation logo

Cognitive Maps in UX | IxDF

Cognitive maps in UX show how users think about a product or service. Designers use these visual representations so they can understand the user's mental model—something that helps them make intuitive designs that match the user's expectations and improve their overall experience.Think about the las

Social shares
537
Published
Read Article

The Principles of Information Visualization for Basic Network Data

The Principles of Information Visualization for Basic Network Data

Not all data has dependencies or a linear structure. In fact some data is related by either or a combination of two properties: connection and containment. These data sets are considered to be networks.

An easy example of a network is the London Underground Tube Network. Here the stations are either connected (via railway lines) or contained (either they are off the grid or not directly connected to each other). The classic London Underground tube map is a good example of information visualization for network data.

Author/Copyright holder: Michael Moore. Copyright terms and licence: CC BY-SA 2.0

The Principles of Information Visualization for Network Data

In his book, “Introduction to Information Visualization” Riccardo Mazza offers four simple principles to consider when designing a network data information visualization:

  • The positions of the nodes

  • The representations of the edges

  • The dimensions involved

  • The interaction elements

Positioning of Nodes

A node is an entity of the network. It may be a physical entity (such as a station on the tube map) or an abstract entity (such as piece of data within a computer network). It doesn’t matter whether a node is physical or abstract but it does matter that a choice is made on how the nodes will be laid out within the representation. The shape, color, dimensions, etc. of nodes can also be used to convey additional information about each node if so desired.

Representation of Edges

Any relationship documented between nodes has to have an edge (commonly shown as a line or an arrow on basic network representations). It is possible for an edge to be indirect or direct and to have direction or no direction. It is also possible to give weight to an edge through the use of numbers, thickness of lines, colours or other visual techniques.

Dimensions Involved

Networks may contain extremely large datasets (think books in the British Library or the US Library of Congress, for example) and these cannot always be represented in neat graphs with simple one-to-one relationships. Considering the numbers of dimensions involved can help the designer solve how these more complex relationships can be conveyed in the information visualization.

Interaction Elements

If you are using software to create the network diagram – you may also have the option to enable users to create their own views within your visualization. It’s best to decide what level of interaction you intend to provide to add the most value to your users before you get bogged down in designing the visualization.

Author/Copyright holder: Simon Pielow. Copyright terms and licence: CC BY-SA 2.0

2 Common Basic Network Diagrams

Let’s take a look at two fairly common basic network diagrams which use the first three principles well. Interaction elements tend to apply only to more complex information sets and as such aren’t a primary consideration here.

The Concept Map

Joseph Novak developed the concept map in the 1970s. They are simple representations showing relationships between concepts (nodes). They use labeled edges (known as propositions) which describe the connection between the two elements.

Concept maps enable the information visualization designer to take a simple concept and slowly extend it by adding further concepts and propositions. They can be very valuable in teaching and education because of this.

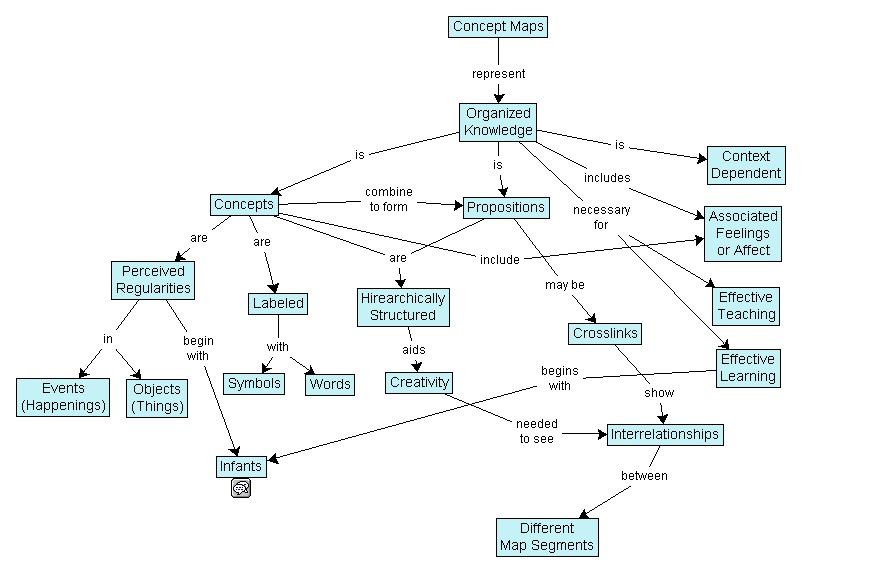
Author/Copyright holder: Vicwood40. Copyright terms and licence: CC BY-SA 3.0

The Mind Map

Tony Buzan, a researcher, developed the mind map concept. They serve a similar function to concept maps. The idea is to create concepts around a specific topic and then link them to each other with an edge describing the relationship.

Mind maps differ from concept maps in that they always work around a single central concept.

Tony Buzan offers many additional rules for developing mind maps in his book “The Mind Map Book”. These techniques are interesting and relate to the visual display of data within the mind map – they are not essential to understanding the mind map as a network diagram but are summarized in the image below.

Author/Copyright holder: Nicoguaro. Copyright terms and licence: CC BY-SA 3.0

Tony says that using mind maps can help; “associate new and unique ideas with ‘old’ ideas that already exist to become exceptionally creative.”

The Take Away

It’s important to consider four factors before developing a basic network data visualization: The positions of nodes, the use of edges, the dimensions to be used and any interactions to be contained within the visualization.

Two common basic tools for representing networks are concept maps and mind maps.

References

Tony Buzan and Barry Buzan. The Mind Map Book. BBC Active, 2006.

Novak, J. D. (1990), Concept mapping: A useful tool for science education. J. Res. Sci. Teach., 27: 937–949. doi: 10.1002/tea.3660271003

More about Joseph Novak.

More about Tony Buzan.

Riccardo Mazza, Introduction to Information Visualization, Springer, ISBN 878-1-84800-219-7

Hero Image: Author/Copyright holder: Toby. Copyright terms and licence: CC BY-NC-ND 2.0

Feel Stuck?
Want Better Job Options?

AI is replacing jobs everywhere, yet design jobs are booming with a projected 45% job growth. With design skills, you can create products and services people love. More love means more impact and greater salary potential.

At IxDF, we help you from your first course to your next job, all in one place.

See How Design Skills Turn Into Job Options
Privacy Settings
By using this site, you accept our Cookie Policy and Terms of Use.
Customize
Accept all

Be the One Who Inspires

People remember who shares great ideas.

Share on:

Academic Credibility — On Autopilot

Don't waste time googling citation formats. Just copy, paste and look legit in seconds.