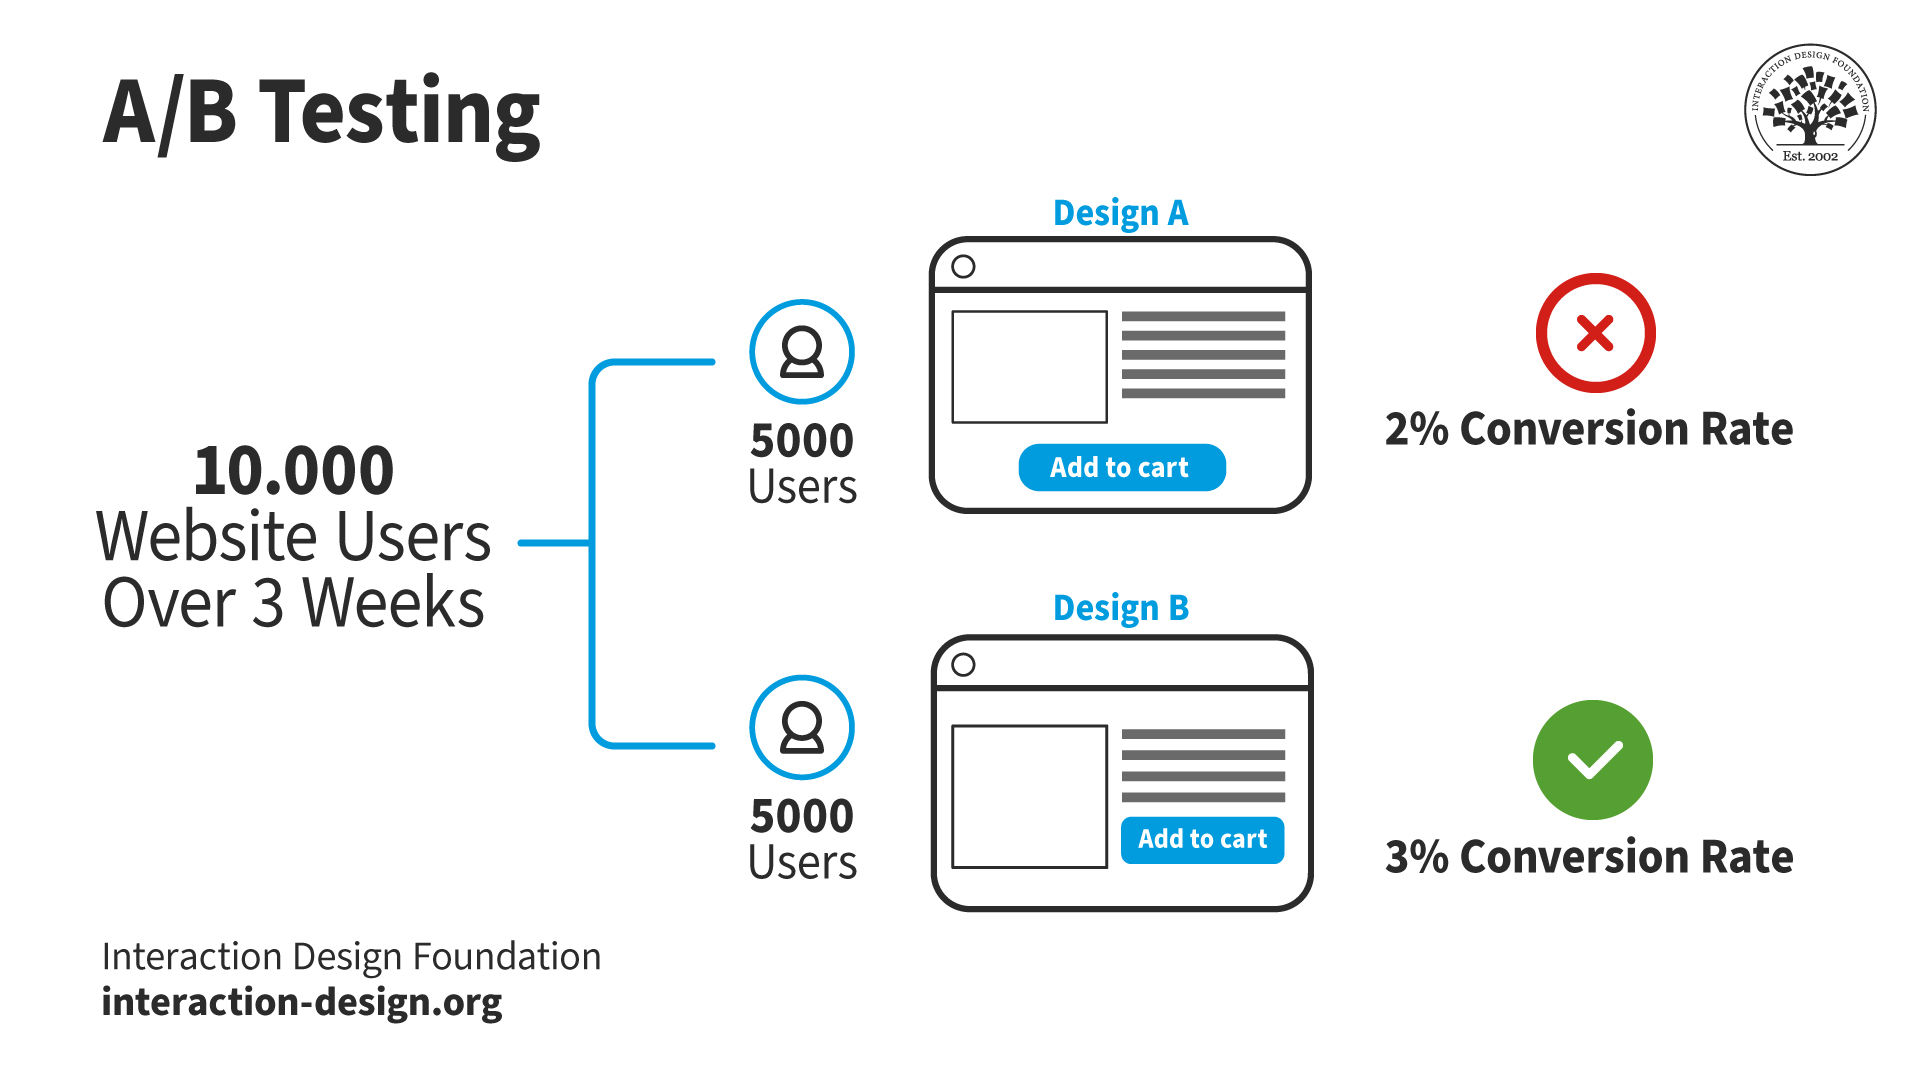
A/B testing, or split testing, is a quantitative user research method. In A/B testing, researchers show different users two versions of the same design to identify which one performs better. The A refers to the original design, while the B refers to the variation of the A design.
A/B testing has applications in many fields, like marketing, social media and retail. However, user researchers and designers primarily use it to test website and application designs.
Researchers and designers use A/B testing to test individual page elements or minor layout variations. They keep everything else on the page the same except the aspect they want to test. This way, they know that any difference in results comes from the variation alone.
A/B testing is quick, easy, and cheap. Designers and researchers choose this method to test slight differences in their designs.
© Interaction Design Foundation, CC BY-SA 4.0
For example, the online streaming platform, Netflix, used A/B/n testing to find which call to action button resulted in more sign-ups. A/B/n testing extends A/B testing by incorporating more than one design variant.

Netflix split site visitors between these four design alternatives. They kept everything the same except the button to ensure their results would be reliable. Once the test was complete, they implemented the phrase “Get Started,” as it resulted in significantly more sign-ups than the other three designs.
© Netflix, Fair use
What Can Designers A/B Test?
A/B testing typically measures the difference in conversion rate between two designs. The conversion rate is the percentage of users who complete a desired action. Some example actions include:
Add item to cart.
Donate money to charity.
Sign up for a newsletter.
Click a specific item in a menu.
Other metrics that A/B testing can measure include:
The time a user spends on a page or site.
The percentage of users who leave a site after viewing only one page (the bounce rate).
A/B testing is limited in what it can measure. However, the variables that researchers can A/B test are almost limitless. Researchers change one variable between design variants and compare the metrics. Here are some examples of variables:
Example | Variable 1 | Variable 2 | Variable 3 |
Style (horizontal vs. vertical) | Icons vs. text | Placement (top, bottom, side) | |
Number of columns | Above-the-fold content | Sidebar presence and position | |
Buttons | Shape and size | Text (“Add to Cart” vs. “Buy Now”) | |
Forms | Number of fields | Field types (dropdowns, text input) | Layout and ordering of fields |
Font styles and sizes | Text color and contrast | Line spacing and text alignment | |
Images and videos | Placement and size | Static vs. carousel | Thumbnails vs. full-size images |
Overall color theme | Contrast ratios | Button and link colors | |
CTA (call-to-action) elements | Placement on the page | Wording and urgency | Design and visibility |
Content strategy | Headlines and subheadings | Length and style of copy | Use of bullet points vs. paragraphs |
Alt text for images | Keyboard navigation | Screen reader friendliness | |
Error messages | Wording and tone | Instructions for resolution | Sound effects |
Search box placement and design | Search algorithms | Filters and sorting options | |
Pop-ups and modals | Timing and frequency | Offer types (newsletter sign-up, discount codes) | Exit-intent vs. timed display |
Email capture forms | Placement and timing | Incentives (discounts, ebooks) | Design elements |
Push notifications | Timing and frequency | Content and call to action | Sound effects |
Meta titles and descriptions | Headings structure (H1, H2, H3) | Keyword placement | |
Pricing strategies | Pricing display ($10 vs. $9.99) | Subscription models vs. one-time purchases | Anchor Pricing (display a higher priced item next to the main product) |
Sales and discounts | Types of discounts (percentage off vs. buy one get one) | Placement of sale information | Original price crossed out vs. savings amount highlighted |
Is A/B Testing Worth It?
“Testing leads to failure, and failure leads to understanding.”
—Burt Rutan
User researchers and designers use testing to make data-driven design decisions and optimize their products' user experience (UX). A/B testing is a highly effective user research method that is:
Cost-effective. Researchers can implement A/B testing with live users following deployment. This approach eliminates the need for expensive pre-launch testing environments. For example, a product manager wants to test two landing pages to see which results in more sign-ups. They split the website's traffic between the two versions. The A/B test gives them valuable data without a significant increase in costs.
Efficient. A/B testing provides rapid results, especially for products with substantial user bases. Sometimes, two weeks of testing is enough to collect actionable data.
Straightforward. Analytics tools provide researchers with clear insights into which design variant performs best. Researchers evaluate outcomes based on predefined metrics, like conversion rates. For instance, a researcher tests two call to action buttons. Analytics reveal the variant that leads to higher conversions. These results provide a clear directive for researchers on which element enhances the user experience.
When Should Designers Use A/B Testing?
In this video, William Hudson explains how to fit quantitative research into the project lifecycle:
A/B testing is unsuitable for assessing the qualitative aspects of user experience. Qualitative aspects include:
Satisfaction.
Comprehension.
Given this, researchers must know what they want to achieve before testing.
For instance, if a researcher relies solely on A/B testing to enhance user satisfaction, it would not provide the insights needed. A/B testing can show users spend more time on a page but cannot explain why users feel more engaged.
When researchers want to understand the 'why' behind user behaviors, they use other research methods. More suitable methods include user interviews, usability testing and surveys. These methods complement the quantitative data from A/B testing.
What Are the Requirements for A/B Testing?
Before a researcher can conduct an A/B test, their website or app must be fully functional. Test results will be unreliable for unfinished products.
For instance, a designer wants to test a product page for a mobile phone case. The page has:
A dropdown menu to choose the case color.
Product photos that change when the user selects a different color.
An “add to basket” button.
The designer creates two designs with different "add to basket" button placements. However, the drop-down list is not functioning correctly. When the user chooses a case color, the product photos change to the wrong color. If users become frustrated, the button's placement will unlikely affect their decision to add to the basket. Any results from the test will be unreliable.
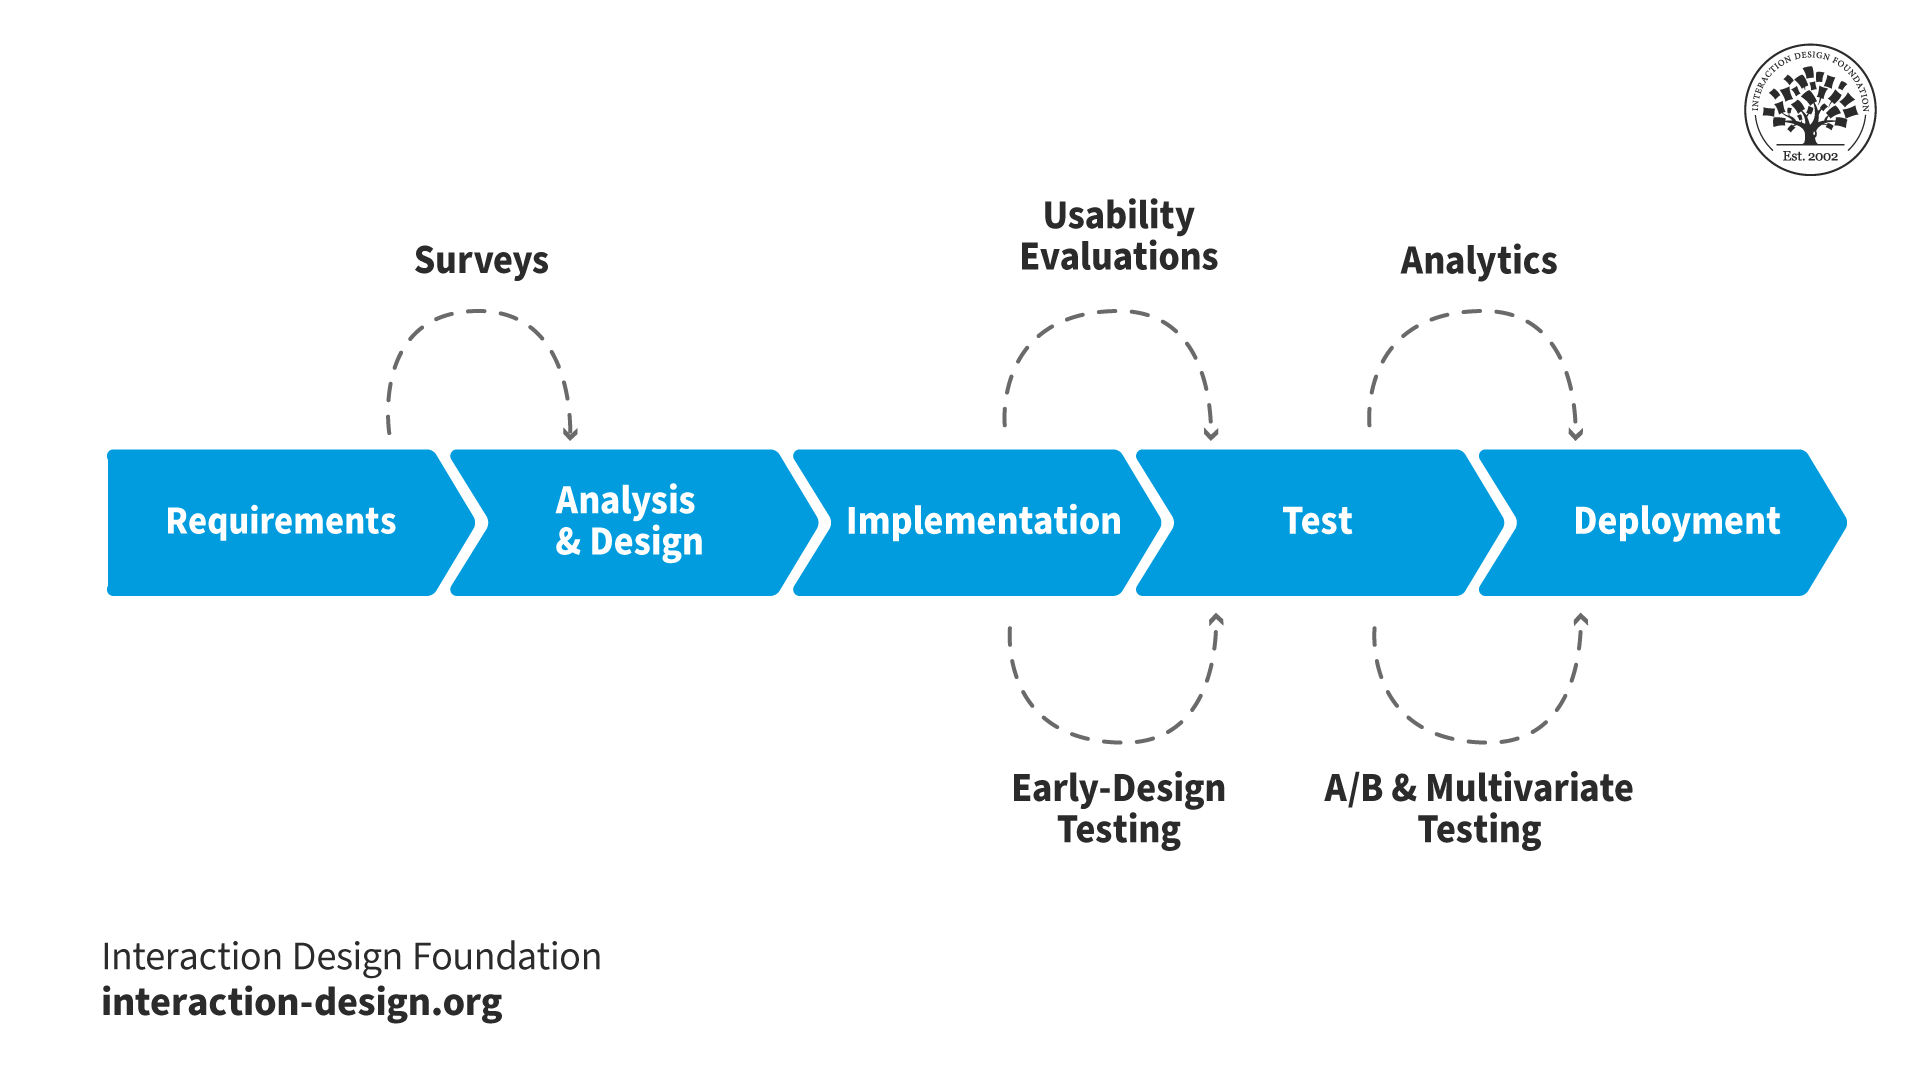
Designers and researchers use A/B testing in the late stages of the development cycle or after deployment. A/B tests need stable, well-designed environments to function correctly.
© Interaction Design Foundation, CC BY-SA 4.0
Also, the number of users tested must be significant enough to see actionable results. Researchers can conduct longer tests for smaller audiences to reach the required sample size. A/B/n testing requires a larger pool of users than A/B testing. More design alternatives mean more participant groups.
A/B sample size calculators help researchers specify a target sample size based on their website’s existing analytics.
Good vs. Bad Research Questions for A/B Testing
Before user researchers conduct testing, they define the questions they want to answer. An example of a bad question is, “Will better product photos reduce the number of customer service queries?” Researchers cannot effectively A/B test this. Many channels to customer service exist, not just product pages.
In this scenario, a good question is, “Will different product photos improve conversions?” Researchers split their users between two different designs, each with different product photos. If significantly more users purchase the product via design B, researchers can be confident:
Users are ordering more.
They are less likely to go to customer service.
Another bad example is, “Will shortening the sign-up process improve user satisfaction?” Satisfaction is challenging to measure with A/B testing, and many ways exist to shorten a sign-up process. The question must be more specific and design-related. For example, “Which design, A or B, leads to more sign-ups?”
How to Run an A/B Test
Once researchers and designers are confident their product is sound and has enough users, they follow a three-part process for A/B testing.
Pre-requisites
Researchers do not need to complete these steps each time they A/B test. However, for first-time A/B testing, these steps are crucial:
Identify key stakeholders. Discover who needs to agree or give resources for the testing. Requirements include getting:
Funding and permission from managers.
Access to existing A/B testing tools and data.
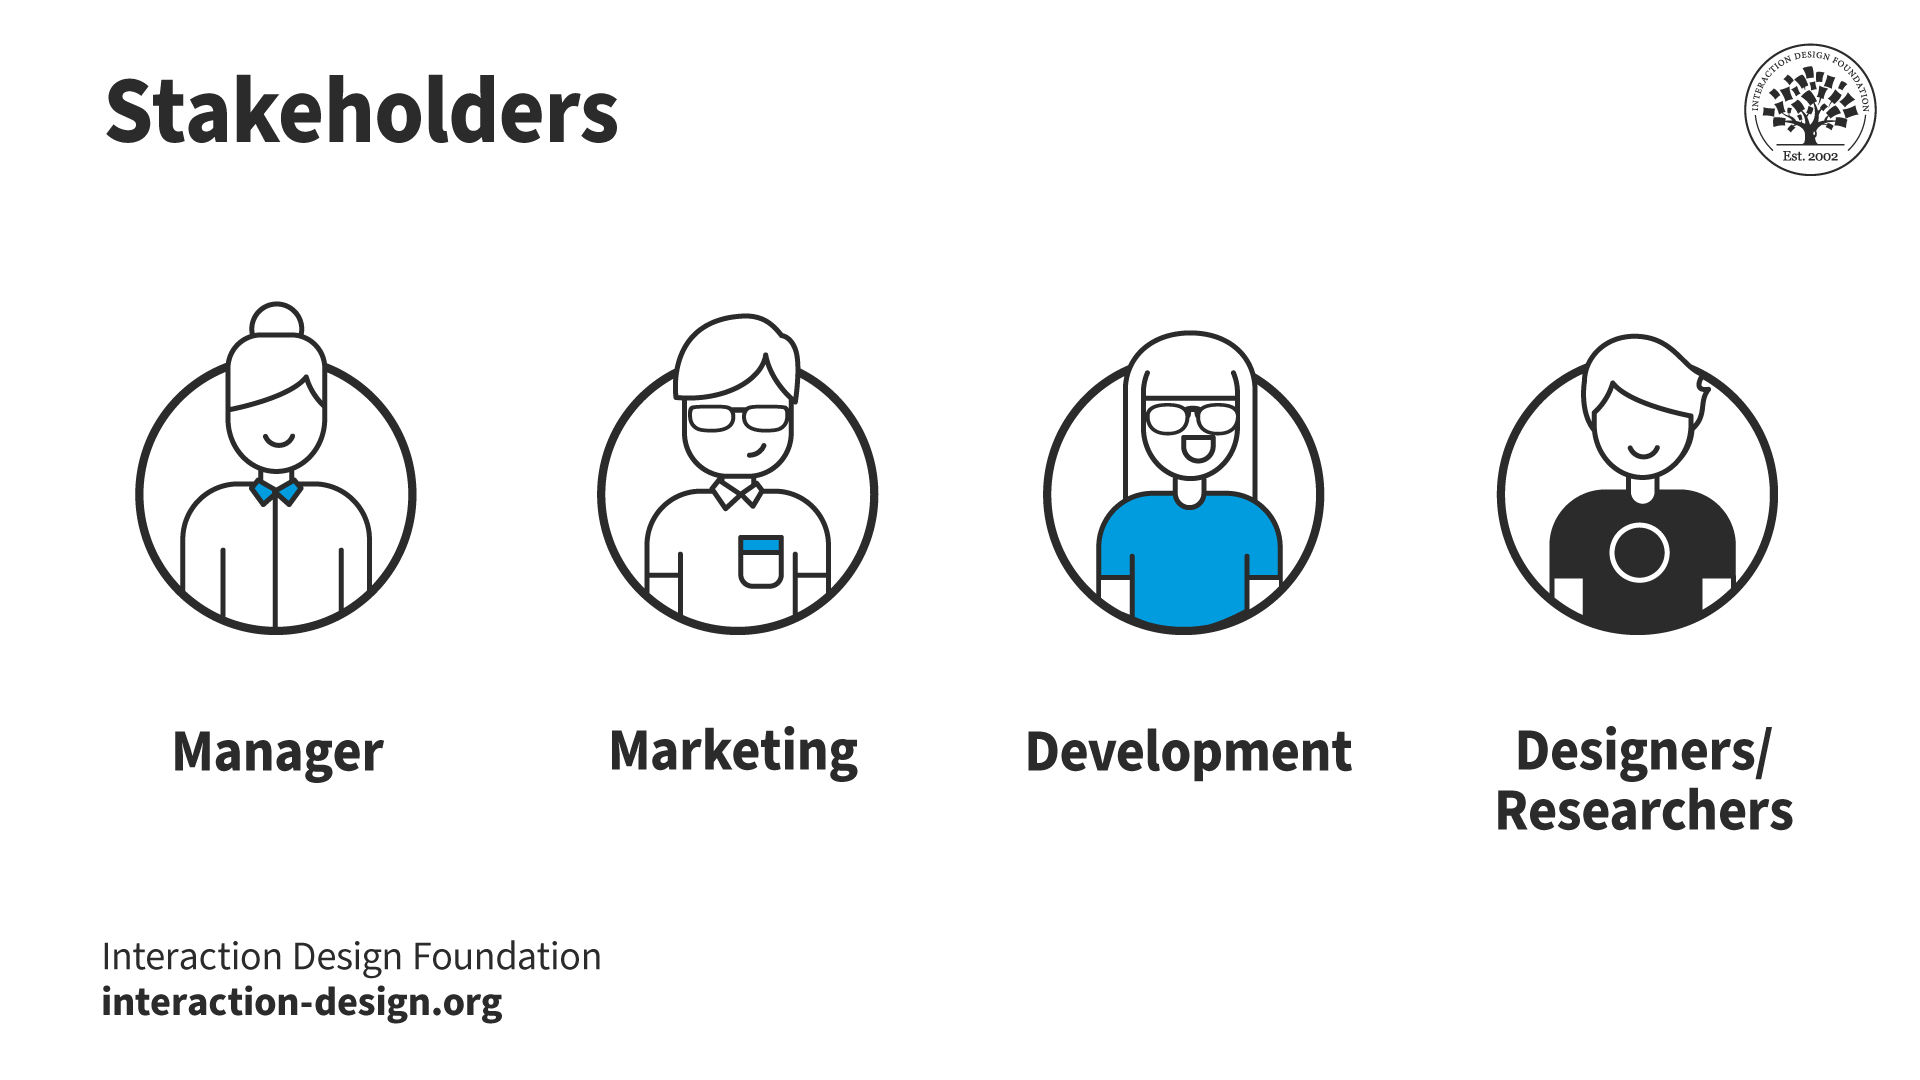
While A/B testing is inexpensive, managers must still approve its use. Marketing or development teams may hold the keys to existing analytics implementations. Finally, design and research colleagues may need to create alternative designs and run the test.
© Interaction Design Foundation, CC BY-SA 4.0
Convince stakeholders of A/B testing's value. It's crucial everyone involved understands why A/B testing is useful. This understanding is critical in scenarios where stakeholders might not be familiar with UX design. Clear examples, like stories of past successes, show stakeholders how A/B testing has helped other projects or companies.
Set up the necessary tools. Choose and set up the software for web analytics and A/B testing. Find the right tools that fit the project's needs and set them up.
Preparation
Once researchers have the required access, permissions and funding, they prepare for the test:
Define research questions. Decide the questions that need answering. For example, “Will changing the button color of a call to action result in more clicks?”
Design the alternatives. Next, create the designs you will test against each other. Make sure these designs are as perfect as possible. For shorter tests, some flaws are acceptable.
Select your user group(s) (optional). Most A/B testing and analytics software allows you to filter results by user group. For this reason, testing specific groups is not always necessary, as you can specify this later. However, if the software doesn’t allow this, you should define this before testing.
Plan your schedule. Finally, decide on a timeline for your test that includes when you'll start, how long it will run and when you'll check on the results. A clear schedule helps manage the test without wasting time or resources.
Results Follow-Up
Once the testing period has finished, researchers view the results and decide their next steps:
Check if the results are reliable. Look at the analytics to see if the differences are significant enough. Minor differences between the performance of designs A and B may be chance. Researchers use methods like chi-square tests to determine whether the results are significant.
If the results are unclear, change the designs and rerun the test, or run the test longer to get more data. These solutions help make sure the next test gives more apparent answers.
If the results are clear, implement the better version.
Keep improving. Researchers don’t only A/B test once; it's an ongoing process. Findings inform and inspire future tests.
Chi-Square Testing for Statistical Significance
Researchers interpret A/B test results to make informed decisions about design choices. A/B testing results are typically straightforward (e.g., which design resulted in more conversions). However, researchers must determine if the results are statistically significant.
Researchers use the chi-square test, a fundamental statistical tool. Chi-square tests play a pivotal role in A/B testing. They reveal whether observed results are statistically significant or chance findings.
Chi-square test results are easy to interpret. If the test indicates a significant difference, researchers can be confident which design is best. For example, a researcher tests two web page versions to increase conversions:
Version A gets 5000 visitors with 100 sign-ups.
Version B gets 5000 visitors with 150 sign-ups.
The researcher analyzes these results using an online chi-square calculator:
They enter each design's successes (sign-ups) and failures (no sign-ups).
They set the significance level at 0.05 (or 5%—the most typical level).
The chi-square test provides a P-value of 0.001362, which is lower than the significance level. Any P-level value under 0.05 is considered statistically significant, while any value over is considered chance.
In this scenario, the researcher is confident their results are statistically significant. They can make design decisions based on these results.
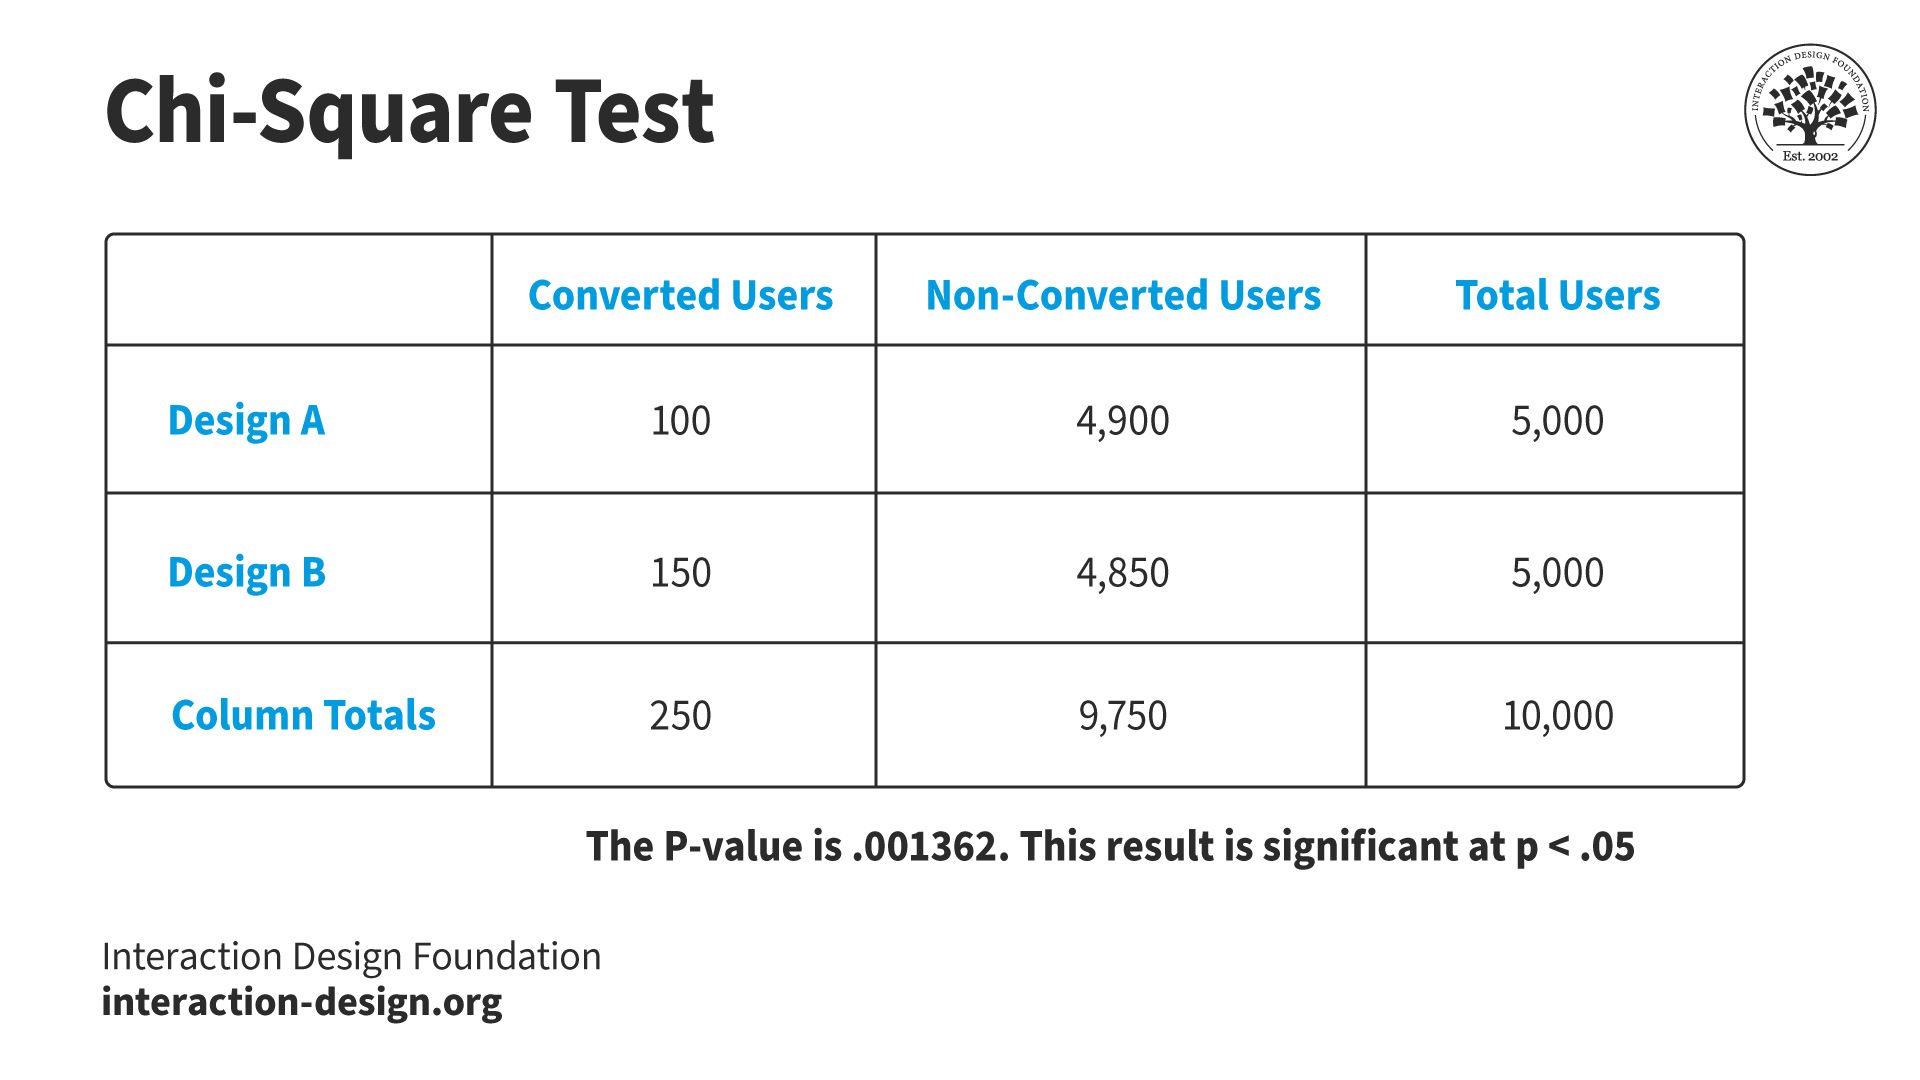
The chi-square test determines if A/B test results are statistically significant. In this example, the difference between conversions may seem small compared to the total users. However, the P-value (the output of the chi-square test) is much lower than the significance level—it is statistically significant. Chi-square tests give researchers and designers the confidence to make data-driven decisions.
© Interaction Design Foundation, CC BY-SA 4.0
Best Practices
Researchers follow these best practices to run A/B tests:
Understand the platform well. Researchers should be familiar with the product before conducting A/B testing. A lack of knowledge leads to unreliable and unuseful results within the context of the platform.
Know the users. Researchers must understand who their users are and what they need from the product. This knowledge is available from existing user research, data and findings.
Choose what to test wisely. Researchers focus on the parts of their site that affect their users the most. For example, an excellent place to start is with user complaints. Other sources, like heat maps and session recordings, provide researchers with test subjects.
Talk to stakeholders. Management and other departments might see problems or have ideas the design team is unaware of.
Set clear goals. Researchers know what they want to achieve with A/B testing. They set measurable goals to guide testing and ensure relevance and focus.
Small changes, big impact. Design changes should be small. Significant changes and overhauls can confuse and upset users. Researchers focus on minor tweaks that make substantial differences.
Use segmentation. Segmentation is helpful after a completed test to review different user groups. Researchers compare demographics and segments like mobile and desktop website visitors.
Limitations and Challenges
A/B testing is typically straightforward and inexpensive. However, researchers must be aware of its limitations and potential stumbling blocks.
Requires a large user base. A/B testing only provides trustworthy results with a sufficient user pool. Without enough people, it might take longer to get results, or the findings might not be reliable.
Outside factors can influence results. External factors like seasonal changes and new trends can negatively affect results. For example, a retailer runs an A/B test on their website during the holiday season to determine the effectiveness of new product photos. However, the increased traffic and buying intent during the holiday season inflates the success of the images. In a regular season, the photos would likely not perform as well.
Focuses on short-term goals. A/B testing typically focuses on immediate results, like how many people click on a button. Long-term goals like customer happiness and brand loyalty are difficult to assess. For instance, a news website runs an A/B test comparing two headline styles to see which generates more clicks. One style leads to a higher click-through rate but relies on clickbait titles that may erode trust over time.
Ethical Concerns. Some tests significantly change what users experience or how products handle their privacy. In these scenarios, researchers must consider ethical practices. For example, an e-commerce site tests an alternative checkout process that adds a last-minute upsell offer. The offer could frustrate users who want to complete their purchases quickly.
A/B vs. Multivariate Testing
Researchers use multivariate testing to test multiple variables between two or more designs. This method is more complex than A/B testing. Researchers may choose multivariate testing over A/B testing for the following reasons:
Complex interactions. It is suitable for examining how multiple variables interact with one another. Multivariate testing can provide insights into more complex user behaviors.
Comprehensive analysis. It allows for a more detailed analysis of how different elements of a page or product work together. This detail can lead to more nuanced improvements.
Optimizes multiple variables simultaneously. It is ideal for optimizing several aspects of a user experience at once. This optimization can lead to significant improvements in performance.
For example, during the 2008 US presidential election, the Obama campaign used multivariate testing to optimize newsletter sign-ups. They tested different combinations of their homepage media (an image or a video) and the call to action button. The team preferred one of the videos. However, testing revealed that an image performed better. This example highlights the importance of user testing and user-centered design.
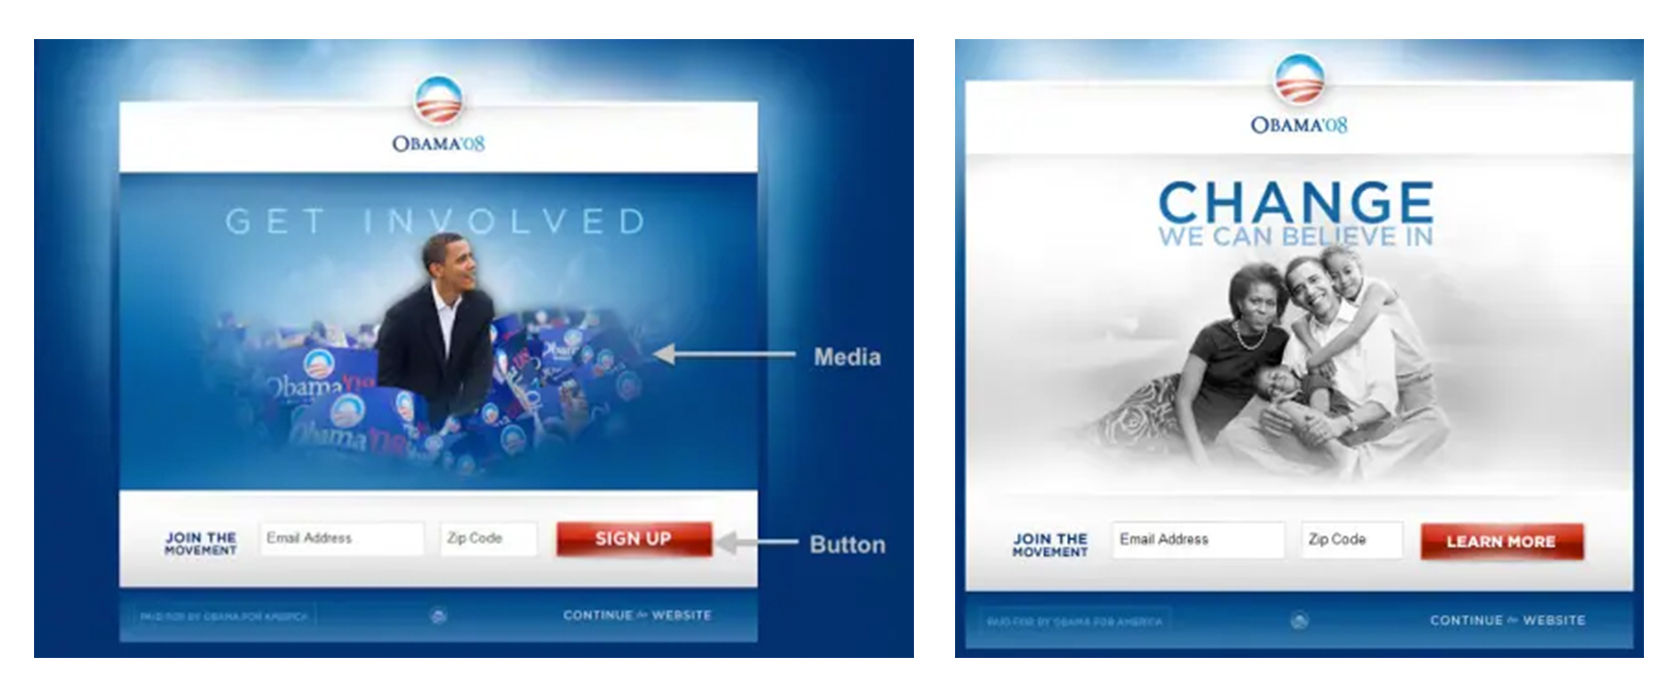
The Obama campaign tested 4 CTA and six media variations (three images and three videos). They found that design option 11 (right image) had 40.6% more signups than the original page (left image). They implemented the more successful design, translating to approximately 2,880,000 additional signups throughout the campaign. These extra signups resulted in an additional USD 60,000,000 in donations.
© Optimizely, Fair use
Researchers may choose A/B testing over multivariate testing for the following reasons:
Simplicity and focus. It is more straightforward to set up and analyze, comparing two versions of a single variable to see which performs better.
Quick to implement. It allows for rapid testing and implementation of changes. This efficiency is ideal for iterative design improvements.
Requires less traffic. It achieves statistically significant results with less traffic. This benefits sites with smaller user bases.
Clear insights. Offers straightforward insights, making it easier to make informed decisions.
Alternatives to A/B Testing
Researchers employ many types of research methods. A/B testing is a powerful tool, but other methods can be more appropriate depending on the situation.
© Interaction Design Foundation, CC BY-SA 4.0
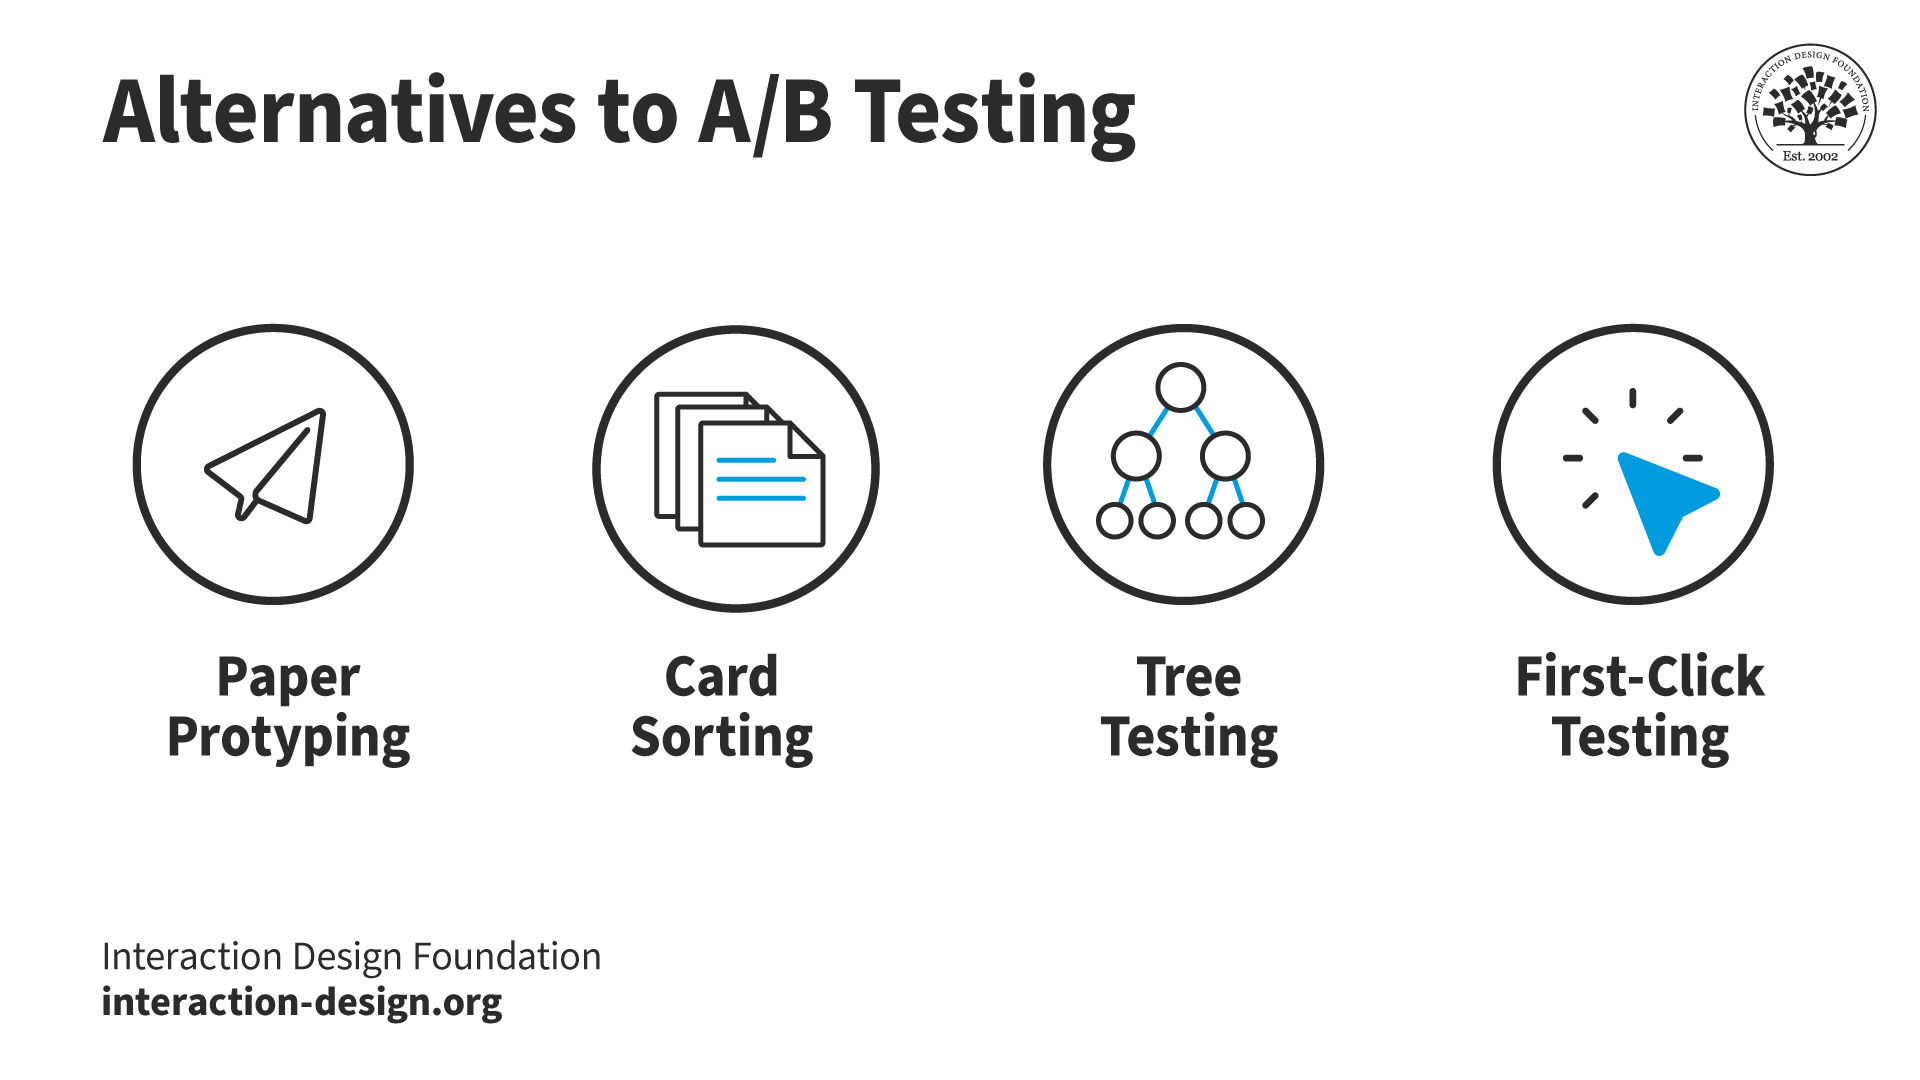
User researchers understand various user research methods. While A/B testing is helpful in many situations, here are four alternatives and why researchers might choose them instead.
Paper prototyping is an early-stage method researchers use for quick, hands-on idea testing. Unlike A/B testing, paper prototyping is about ideation and immediate reactions. Researchers use this method to generate quick feedback on basic design concepts. Paper prototyping happens before the costly development phase. This approach helps researchers quickly identify user preferences and usability hurdles.
Card sorting dives deep into how users mentally organize information. This method offers insights that are sometimes not revealed in A/B testing. Researchers employ card sorting to structure or restructure a product's information architecture. Users group content into categories and reveal patterns that guide information organization. This method ensures the final structure aligns with user expectations.
Tree testing focuses on evaluating the navigational structure of a site. Designers and researchers use this method to refine an existing navigation. Tree testing can also confirm a new structure's usability. This method strips away the visual design elements and focuses on how easily users can find information. Researchers choose this targeted approach over A/B testing to identify navigational issues.
First-click testing assesses a web page layout's immediate clarity and key actions. Researchers use this method to understand if users can quickly determine where to click to complete their goals. A/B testing does not always reveal this information. First-click testing offers precise feedback on the effectiveness of the initial user interaction.


